This post is an example of setting up a Playwright test framework for a web application. It assumes Playwright has already been installed and configured for Visual Studio Code (see previous blog post for a reminder).
As of 2026 Playwright has become increasingly in demand in the role of a Software Test Engineer- it’s now is rapidly closing the gap on other tools (source: ContextQA, “Playwright vs Selenium vs Cypress in 2026”, April 2026). If you’re new to Playwright or want to know more, the good news is in my experience it’s straightforward to install, and intuitive to start using.
This post takes it a step further in setting up a Playwright framework for a simple web app simple web app, demonstrates some of the key points around structure, using fixtures and pages for each test, api testing, managing test data and covers some of the powerful tools playwright has. This is by no means a full list of Playwright capabilities, but does give practical examples on how to go about structuring the Playwright framework, and links to the Playwright documentation where appropriate to provide more detail.
System Under Test
The system under test for this post is an application created which uses a sql backend, and spring boot to set up a web based front end, served by rest APIs. This was a straightforward architecture but is relevant in my experience to commercial projects- it’s possible to use any example project that follows this structure:
Layer
Technology
Backend
Java + Spring Boot
API
REST (JSON endpoints via @RestController)
Data access
Spring Data JPA + SQLite (existing database, no migration needed)
Tests
Playwright (TypeScript or Java)
Front end
html
Note: It’s feasible to use a test website like www.demoblaze.com which has APIs, a front end etc. but this
project enables test data management, and a closer look at back end data.
Playwright Structure
Abstracting page objects and helpers
One of the fundamental aspects of Playwright is that it spins up a dedicated browser context for each test- so each test is ‘isolated’ from previous test runs, ensuring that cookies, storage, and state from one test never “leak” into the next. However, tests can (and should) reuse shared page objects using the page object model.
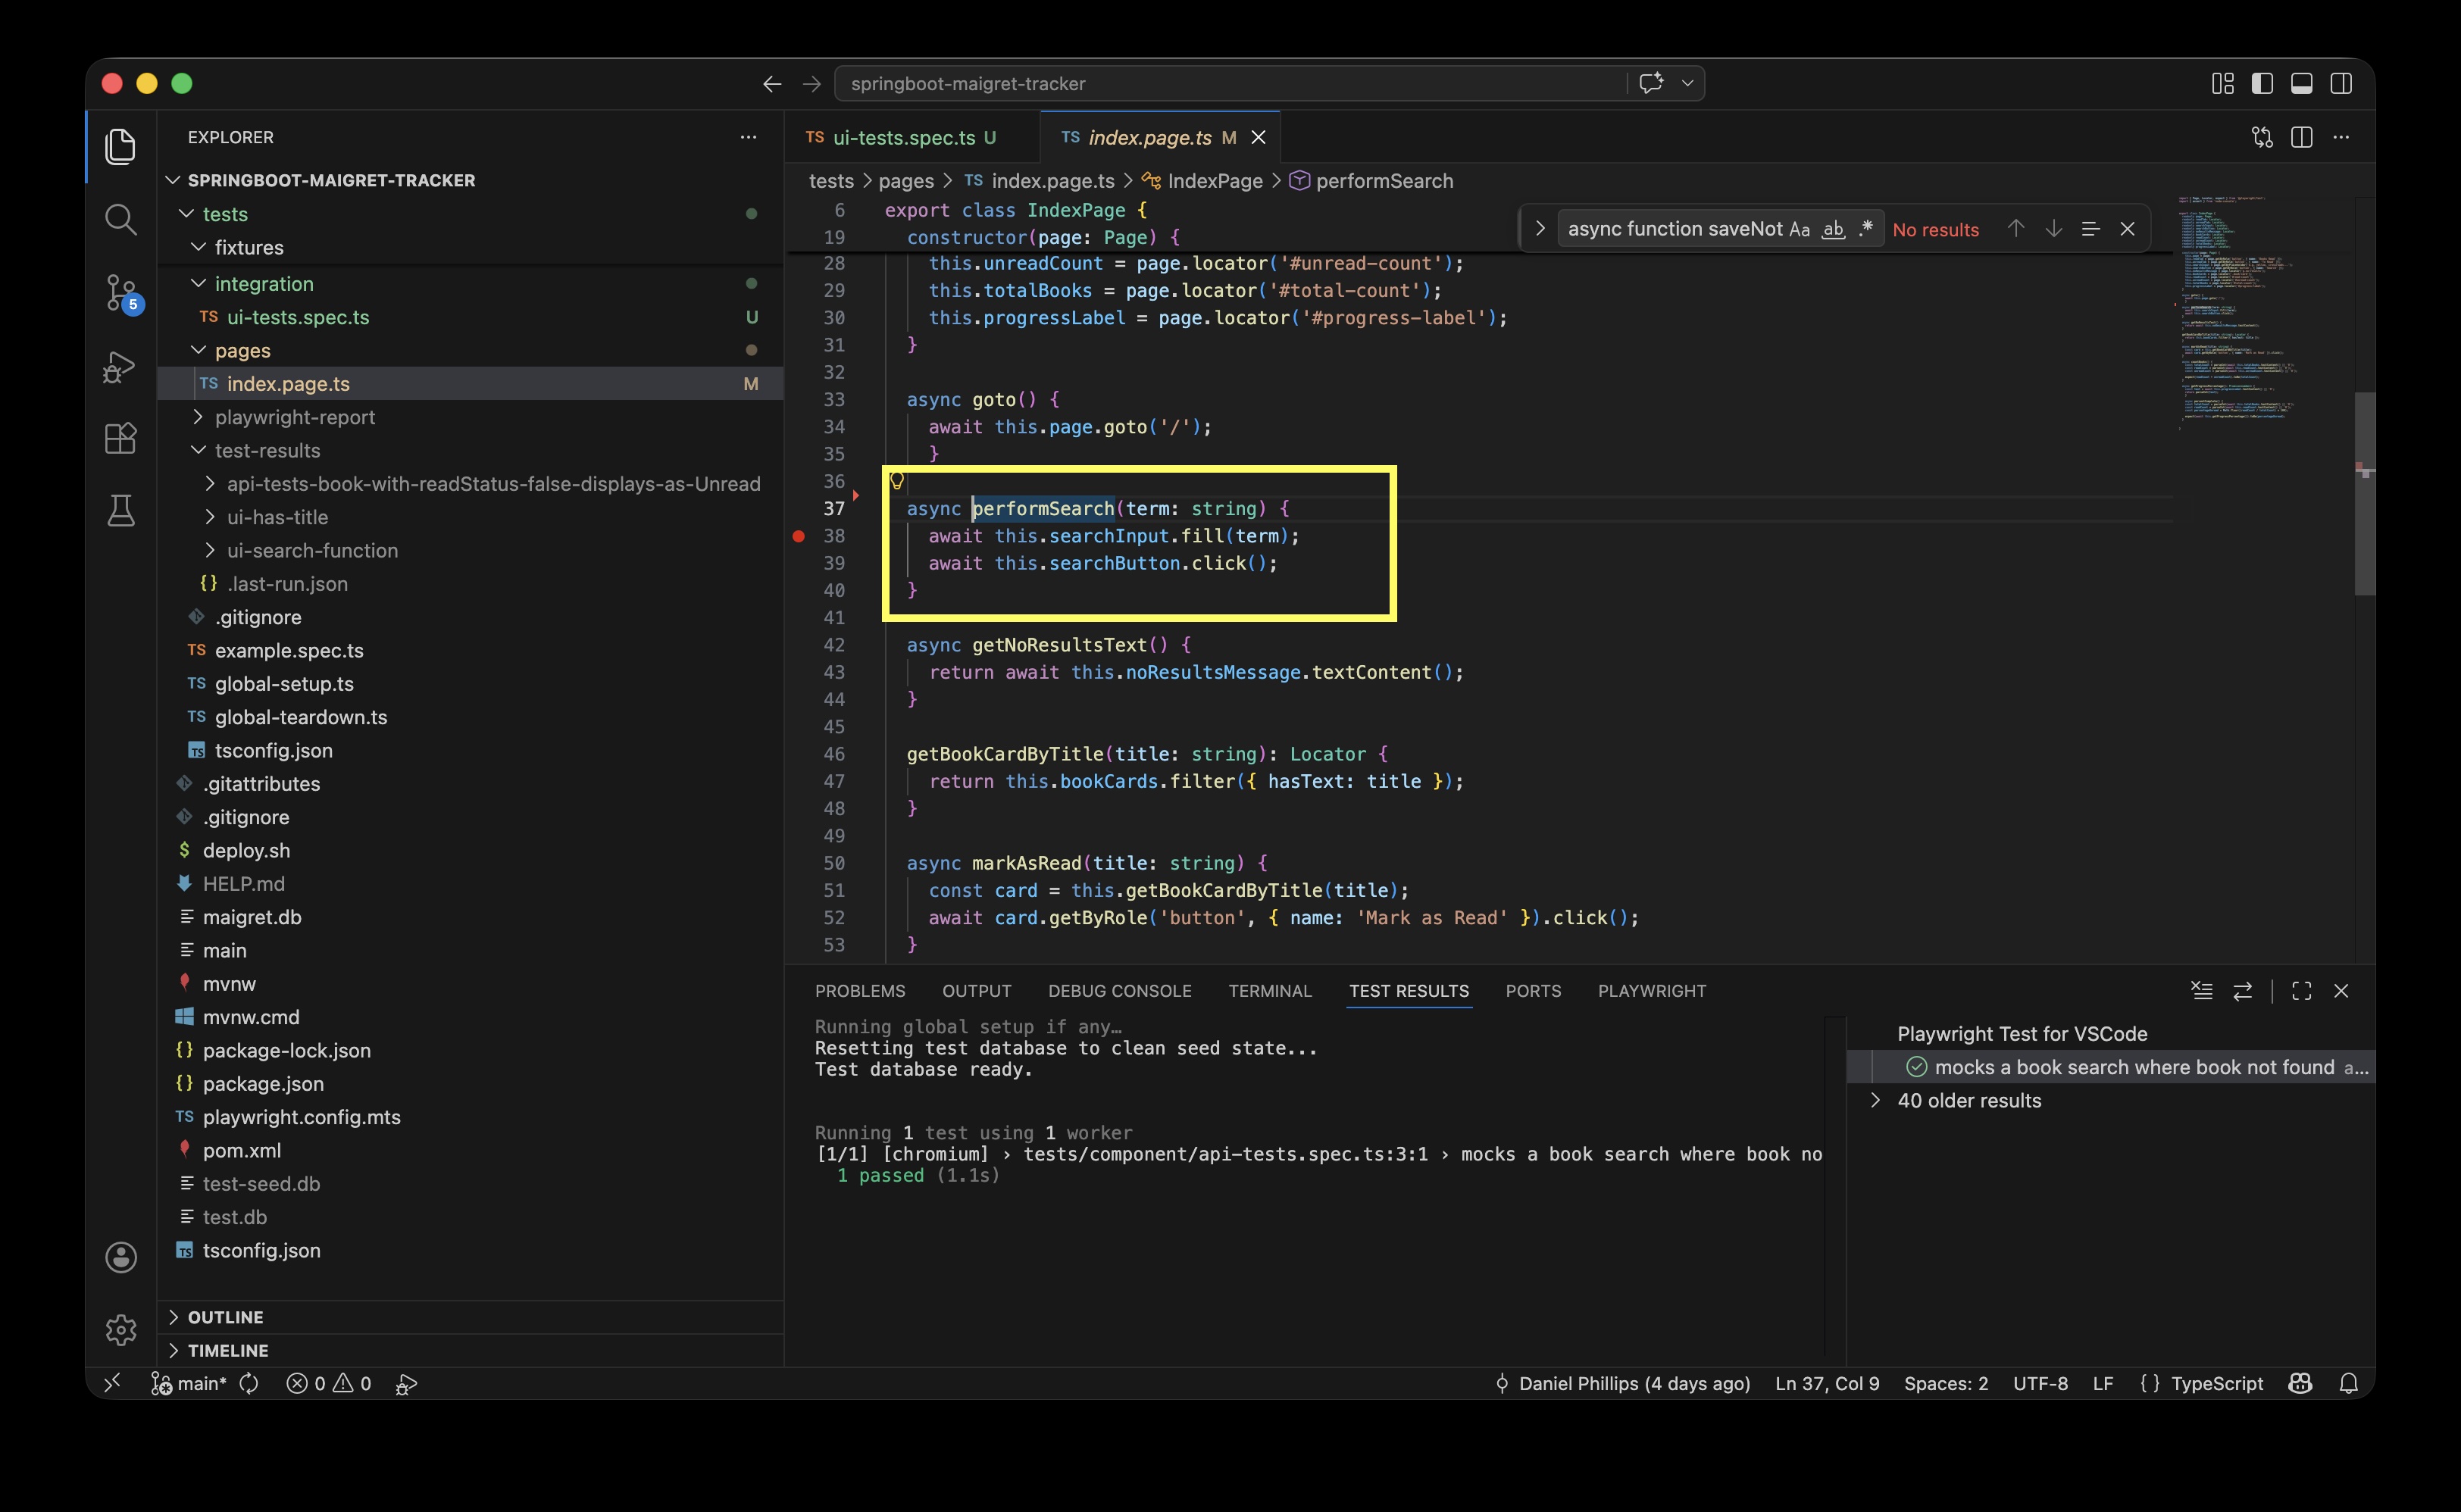
Using the page object model allows each web/application page to have it’s own class for locators, helpers etc. so multiple tests can re-use this page class. For example in this project, the Page Object Model ‘indexPage’ for the landing page contains all locators and helper functions relevant to the index page tests.
This approach can be used for other component objects (sidebars, footers etc.), and as we only have to update locators in one place is maintainable, and as the locators/helpers are abstracted to this page class the test class is a lot more readable- it only needs to focus on the logic of the test, the implementation is abstracted to the page class.
Example: in this integration test, the indexPage page is imported and the test can use the performSearch helper.:
test('search word not found, returns no results',async({indexPage})=>{awaitindexPage.goto();awaitindexPage.performSearch('green');awaitexpect(indexPage.noResultsMessage).toBeVisible();awaitexpect(indexPage.noResultsMessage).toHaveText('No books found.');
The indexPage page class contains the performSearch method:
If the test didn’t use the page class and its helper, the functional code would have to be included in the test itself- it would work but would make the test harder to read (more lines of code), more effort to maintain, and the function would have to be repeated for any other test performing a search on the index page.
The test folder for this project covers two different levels of testing- component and integration tests.
Integration tests — real Spring Boot + real SQLite
Test the whole stack works together
Need the test DB
Slower, but proves end-to-end behaviour
Component tests — Playwright intercepts all API calls
Test the frontend in isolation
No backend needed (still needs the front end server running)
Faster, great for edge cases
Note: By default Playwright (and other tools like Cypress) assume there is a third level at the top of the test pyramid, end to end (e2e). For this project given there are currently no actions such as auth log in, add/remove books the UI is effectively covered in the integration tests- but be aware you would usually see an e2e test level as well.
In integration tests we look at a straightforward example to see Playwright syntax, and also consider how to handle test data where an integration test does a write/update action. The project’s component tests includes tests which mock data, and we look at page.route().
Integration tests
Integration tests interact with the backend data and the front end ui, and are used to test the end-to-end process i.e. a button click initiates an api to fetch data, and the response is displayed on the front end.
For example the integration test search word not found, returns no results involves:
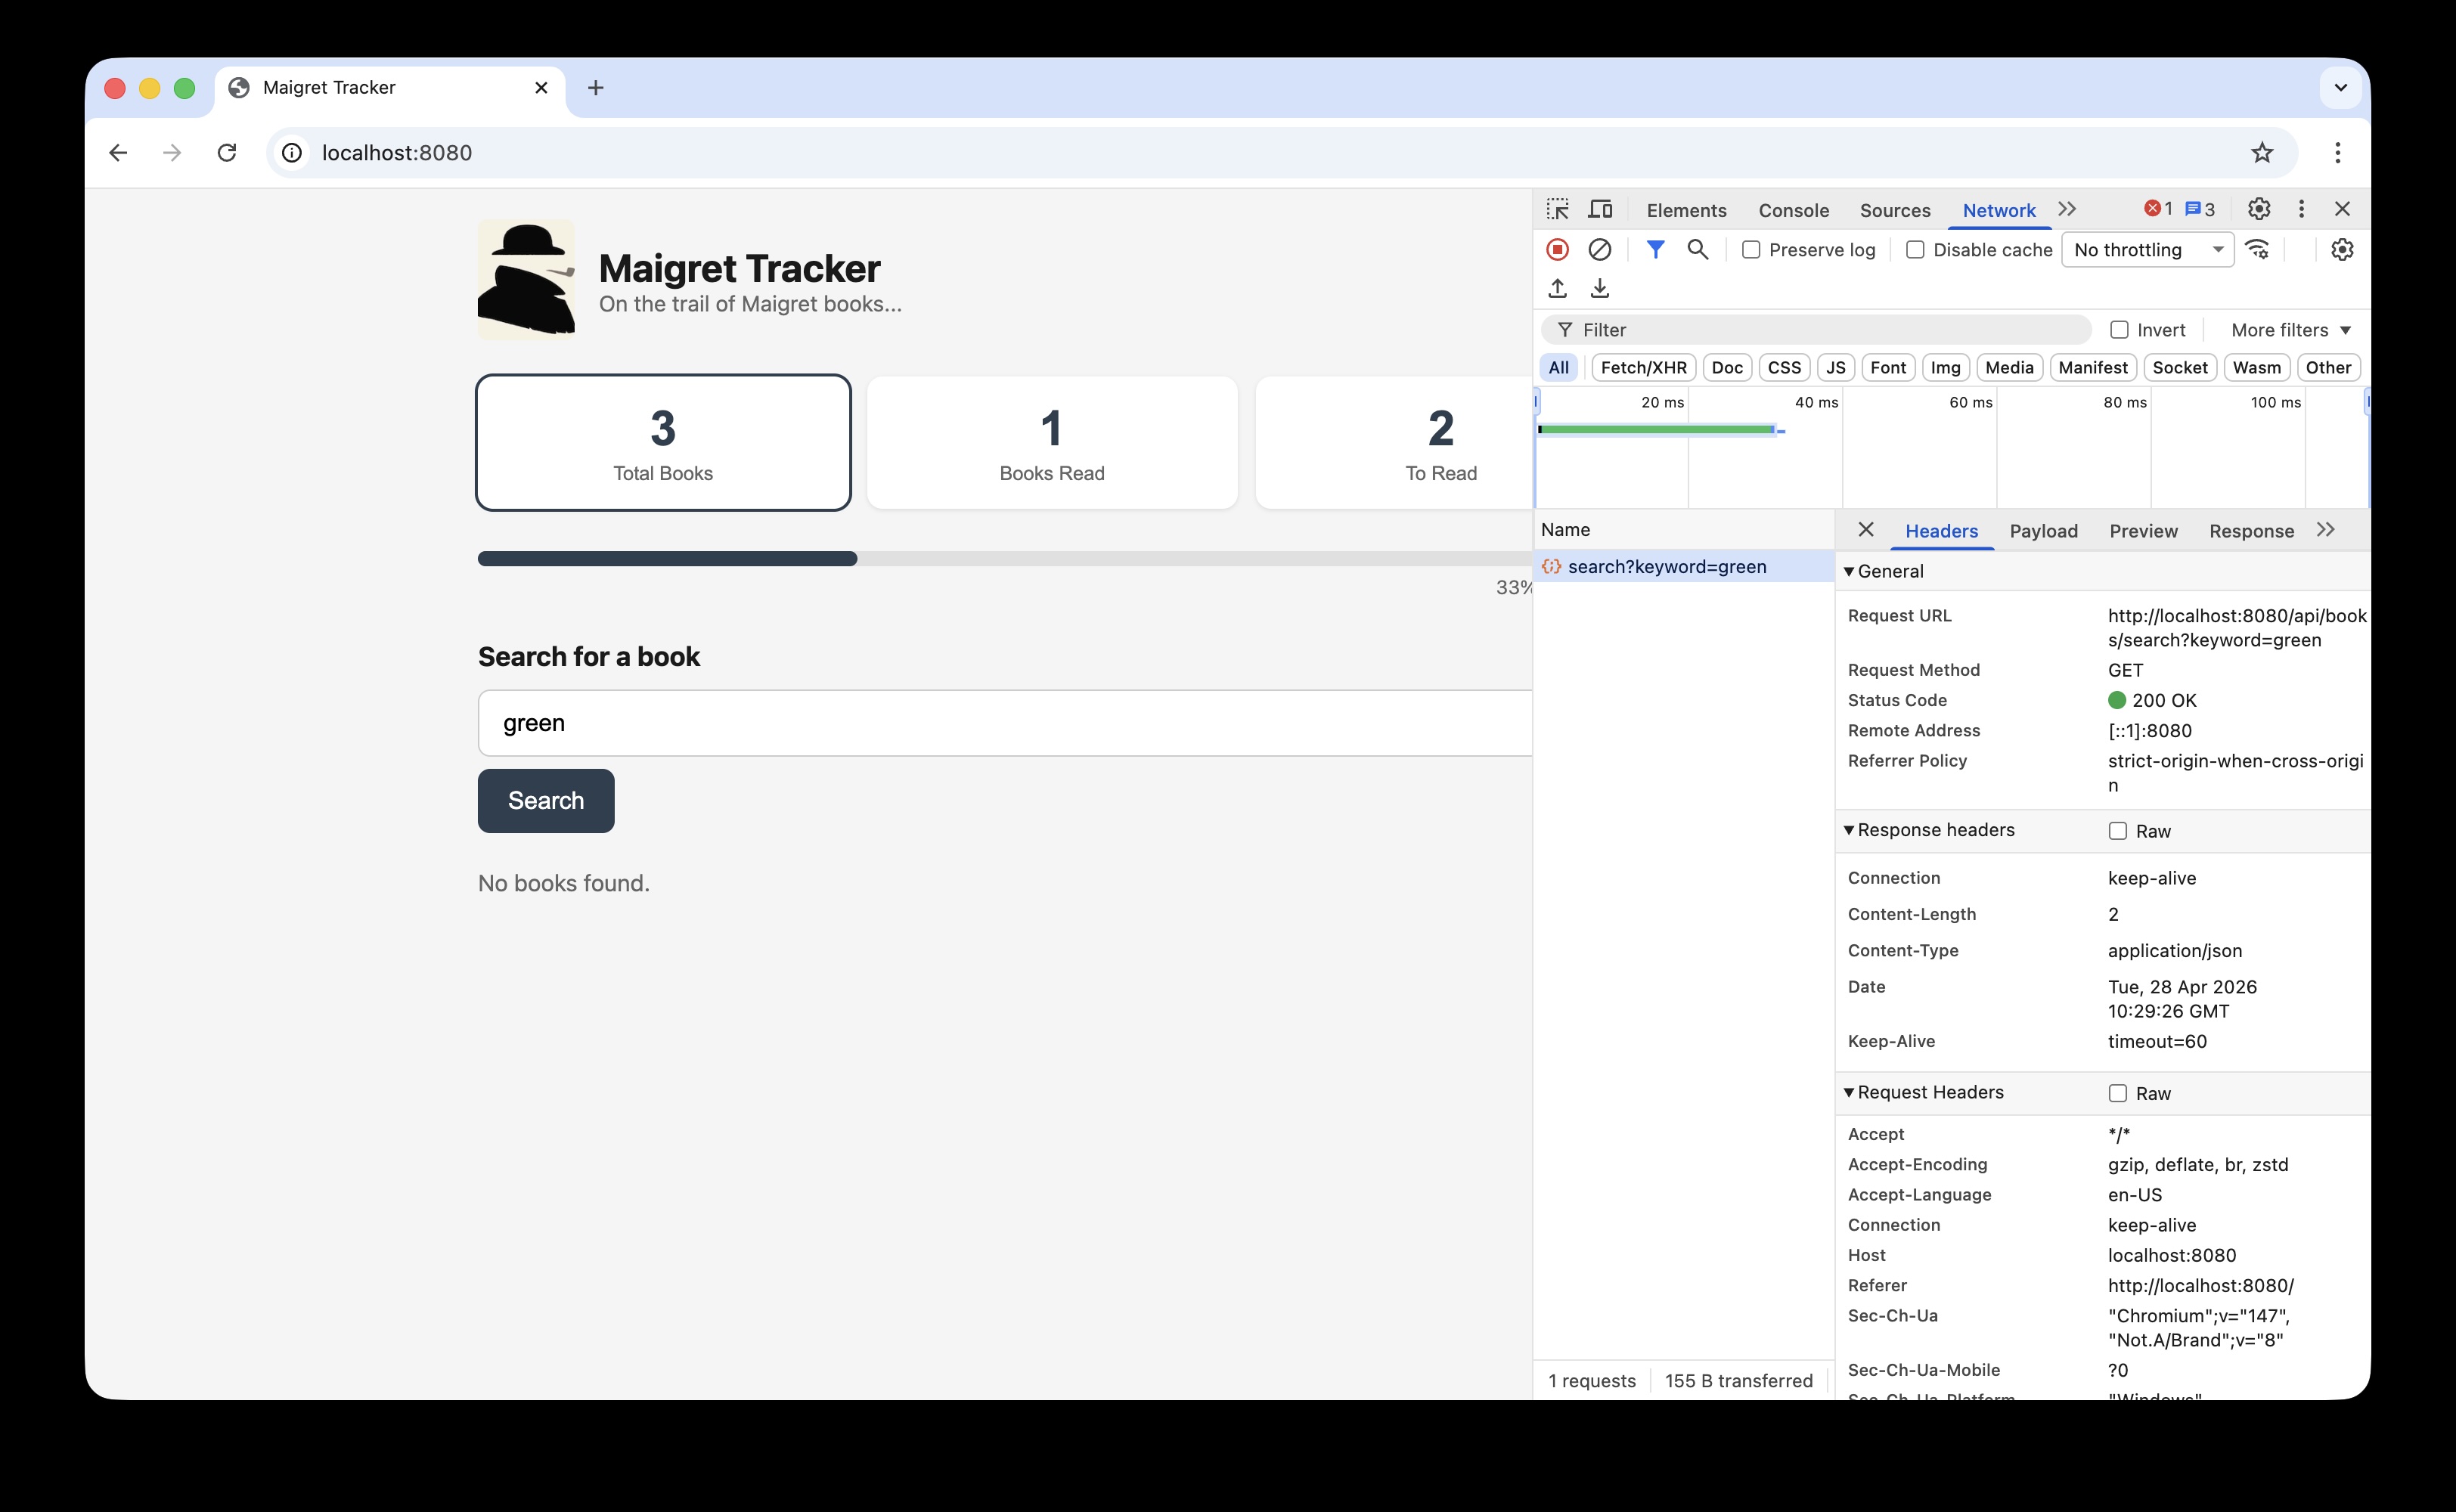
inputting a search word in the ‘Search for a Book’ field e.g. ‘green’
clicking search to trigger the url `http://localhost:8080/api/books/search?keyword=green
There are currently no books in the books table with ‘green’ in the title, so the response returned is an empty array [] - front end displays “No books found.”
In the screenshot below clicking ‘Search’ where the search word is ‘green’ creates an API endpoint to read the books table, searching for the keyword green (../api/books/search?keyword=green):
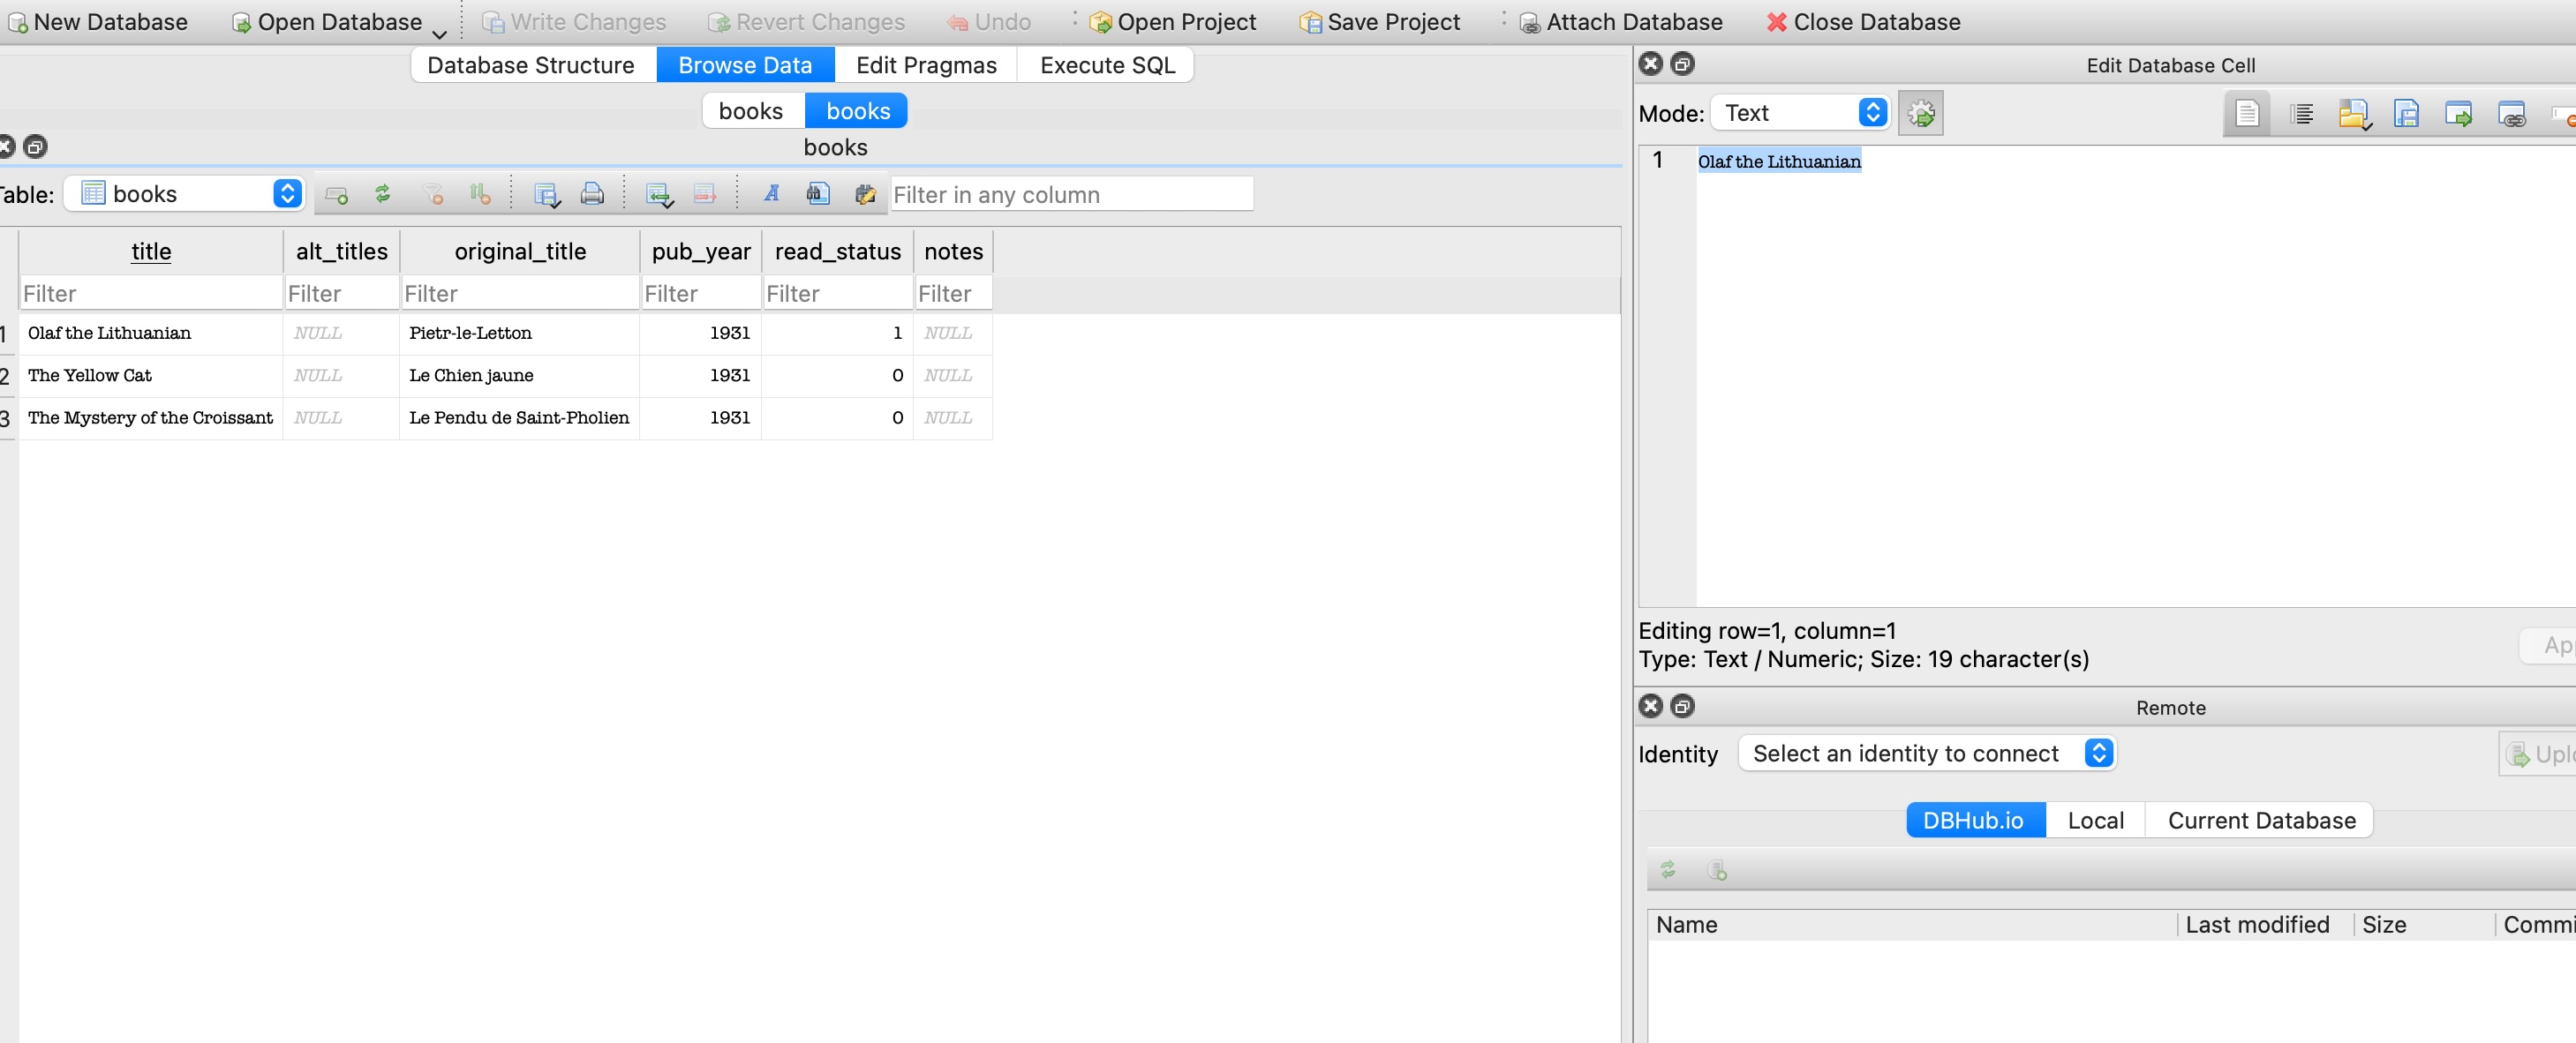
This api endpoint reaches the test books sql table, note are no books with ‘green’ in the table:
Managing test data
The previous integration test read the data in the database, but in the UI test class there is a test updating a book from unread to read that updates values:
test('updating a book from unread to read',async({indexPage})=>{awaitindexPage.goto();awaitindexPage.getBookCardByTitle("The Yellow Cat")awaitexpect(indexPage.statusBadge('The Yellow Cat','unread')).toBeVisible();awaitindexPage.markAsRead('The Yellow Cat');awaitexpect(indexPage.statusBadge('The Yellow Cat','read')).toBeVisible();});
This test changes the status of a book to read, which then changes the number of read versus unread books on the index page. The integration test class has subsequent tests which verify the expected number of read books, which would then fail if this test changes that underlying data.
At this stage we need to consider how to manage test data. This is a challenge for all types of software testing, and while it’s not unique to Playwright its worth demonstrating one solution applied to enable effective integration testing in the Playwright framework.
In this project the solution adopted is to create a copy ‘test’ database using the same schema as the ‘production’ table, but populated with test data.
As integration tests are run against an instance of a test database, the test can create, read, update or delete data without compromising the original data. To clear down test data, we keep a test-seed.db table with the original test data, this is copied over test.db by the global setup class, the tests then run and read/write/delete test data, but the original data is reset by the global teardown class.
In other words before each test the @beforeAll action copies test-seed.db over the test.db, so each time the updating a book from unread to read test run it starts with the book in question in an unread state, updates it, then the @afterAll action resets that book record to ‘unread’.
Given I search for a book title which does not exist in the book database
When I click ‘Search’
Then I should see the book does not exist
This could be tested as an integration test, i.e. when the test clicks ‘Search’ the actual search api is invoked, and real data is read from the back end database. This works functionally, but given the test objective is purely the response generated when there are no search results, i.e. a discrete component rather than an integrated feature, it would be more efficient to mock the api response rather than make an api call to the backend.
As an example of this , the component test 'No books found' on screen when a book not found calls the same api endpoint http://localhost:8080/api/books/search?keyword=green, before looking at the test code its helpful to inspect the api.
Inspecting REST APIs with Swagger
In order to mock API responses, before we look at Playwright’s powerful page.route tools we need to understand the API layout and content.
Inspecting REST APIs with Swagger
We can check an API via Developer Tools → Network tab, but using Swagger lets us connect our REST APIs, view them in a list in a browser, and try them out. It's useful for this project as we can try out the books search API for the 'green' keyword to prove it returns no results before we write the test — without needing to run the app or trigger a real browser request.
To install, add a dependency to pom.xml:
Checking the api details with Swagger allows us to confirm the url endpoint path (i.e. the request url) and the response body (in this simple example, the `[]` for an empty array).
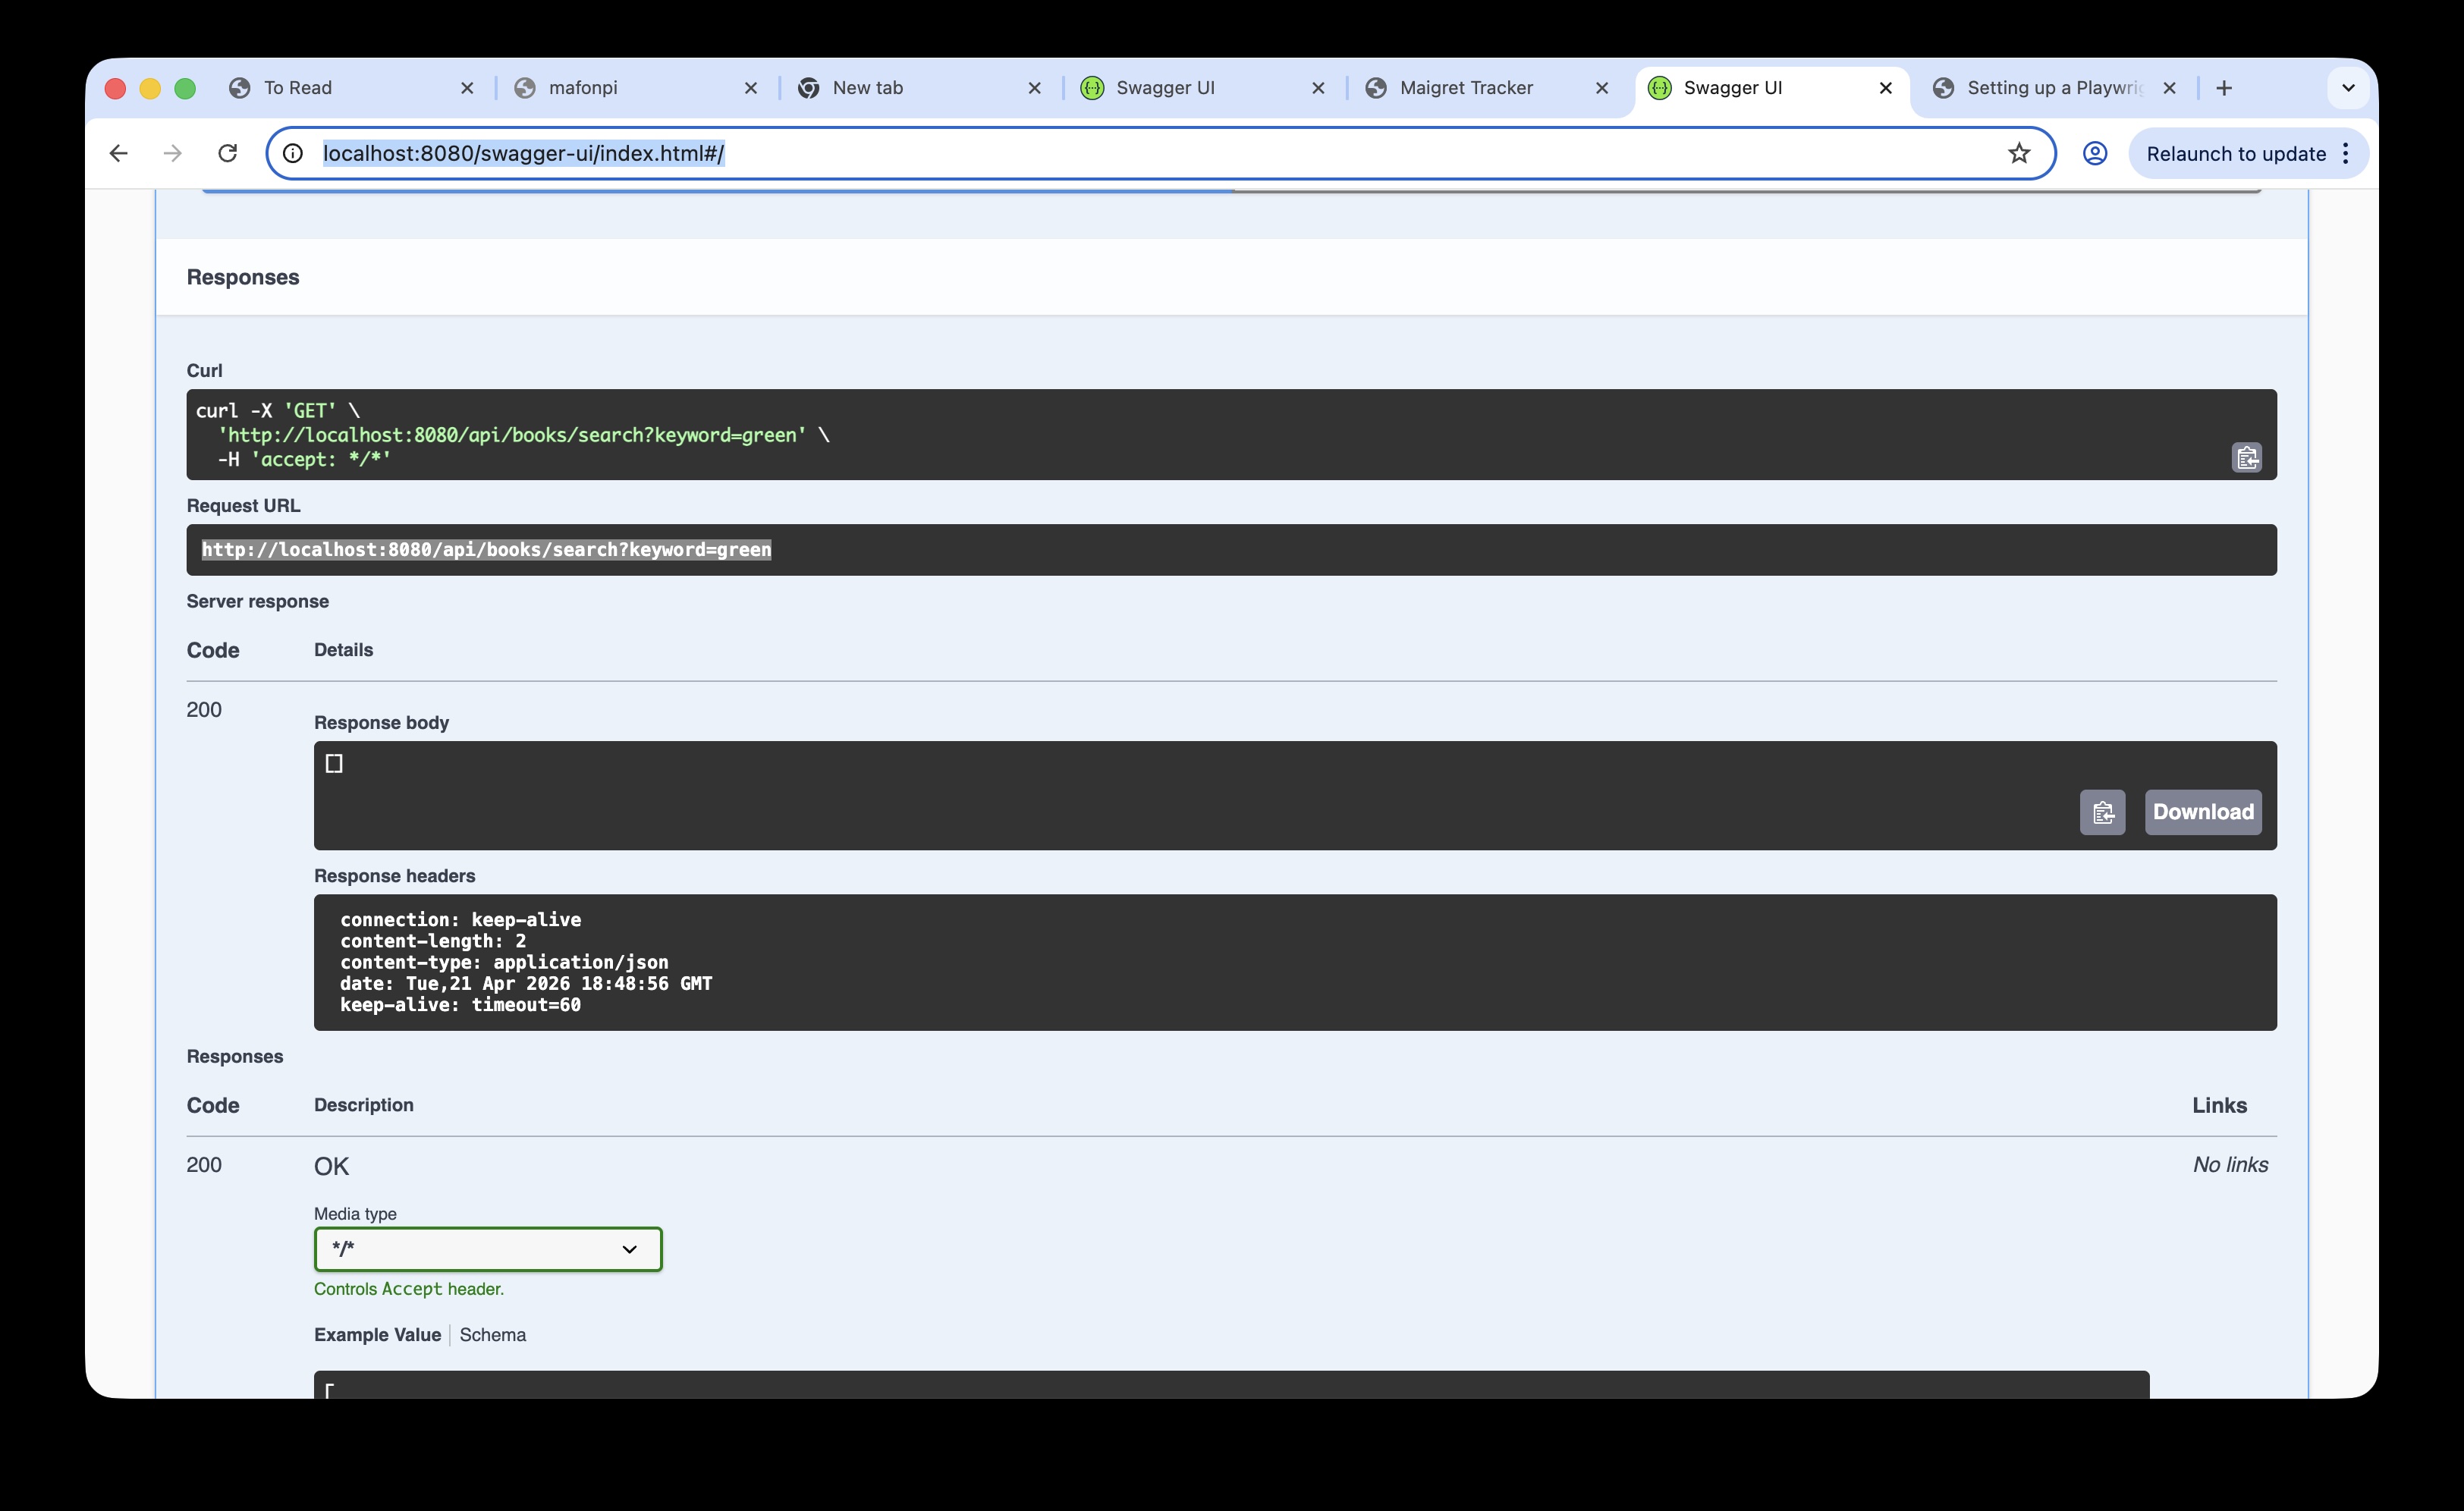
> Swagger isn't a requirement to write API tests, but it's very useful for understanding the API call and response before writing tests.
Page.route()
Now that we have visibility and an understanding of the API used when searching for a book, the page.route method extends that to allow us to modify the network requests that are made when ‘Search’ is clicked. This allows us to mock the API response - i.e. when the api endpoint in the test is hit the test uses a mocked json response as the api response, rather than call the actual back end database.
Example
In the Swagger response we saw that the endpoint is http://localhost:8080/api/books/search?keyword=green. Given this is going to use mock data, we can drop the search word and intercept this path ‘/api/books/search’. This sets this api endpoint as the route object, we can apply the function action to return the mock json response, in the example below we want to return an empty array [] (to mock a search result with no books returned).
This simple example triggers the ‘No books found’ message without having to read the back end database to confirm no search results were found, and it ensures that even if many books to our test database, the search term for this specific test will always return the not found result- effectively just testing the not found response, not relying on data.
The other advantage of using mock data is that we can test for edge cases by setting json responses which would be awkward with real data, for example when the front end fails to fetch data from the table.
In the test below, rather than route.fulfill to return our mock json we can test what would happen if the api failed to connect to the back end data by using page.abort(). This aborts network request itself, so the json array for the books api does not load:
test('index page still renders even if books fail to load',async({indexPage,page,request})=>{// Fetch real data firstconstresponse=awaitrequest.get('http://localhost:8080/api/books');constbooks=awaitresponse.json();// Intercept and abort the loading of booksawaitpage.route('**/api/books',route=>route.abort());//assert index page loads and 0 books have been loadedawaitindexPage.goto();awaitexpect(indexPage.totalBooks).toHaveText('0');});
Example Structure
The file tree below summarises the structure for this project, while there isn’t a set Playwright file structure this is a standard example of where the key folders and classes should sit:
Playwright tools
The scope and range of tools in Playwright is extensive, but these are some examples of tools that would address test scenarios in actual projects in my experience.
Visual Comparisons
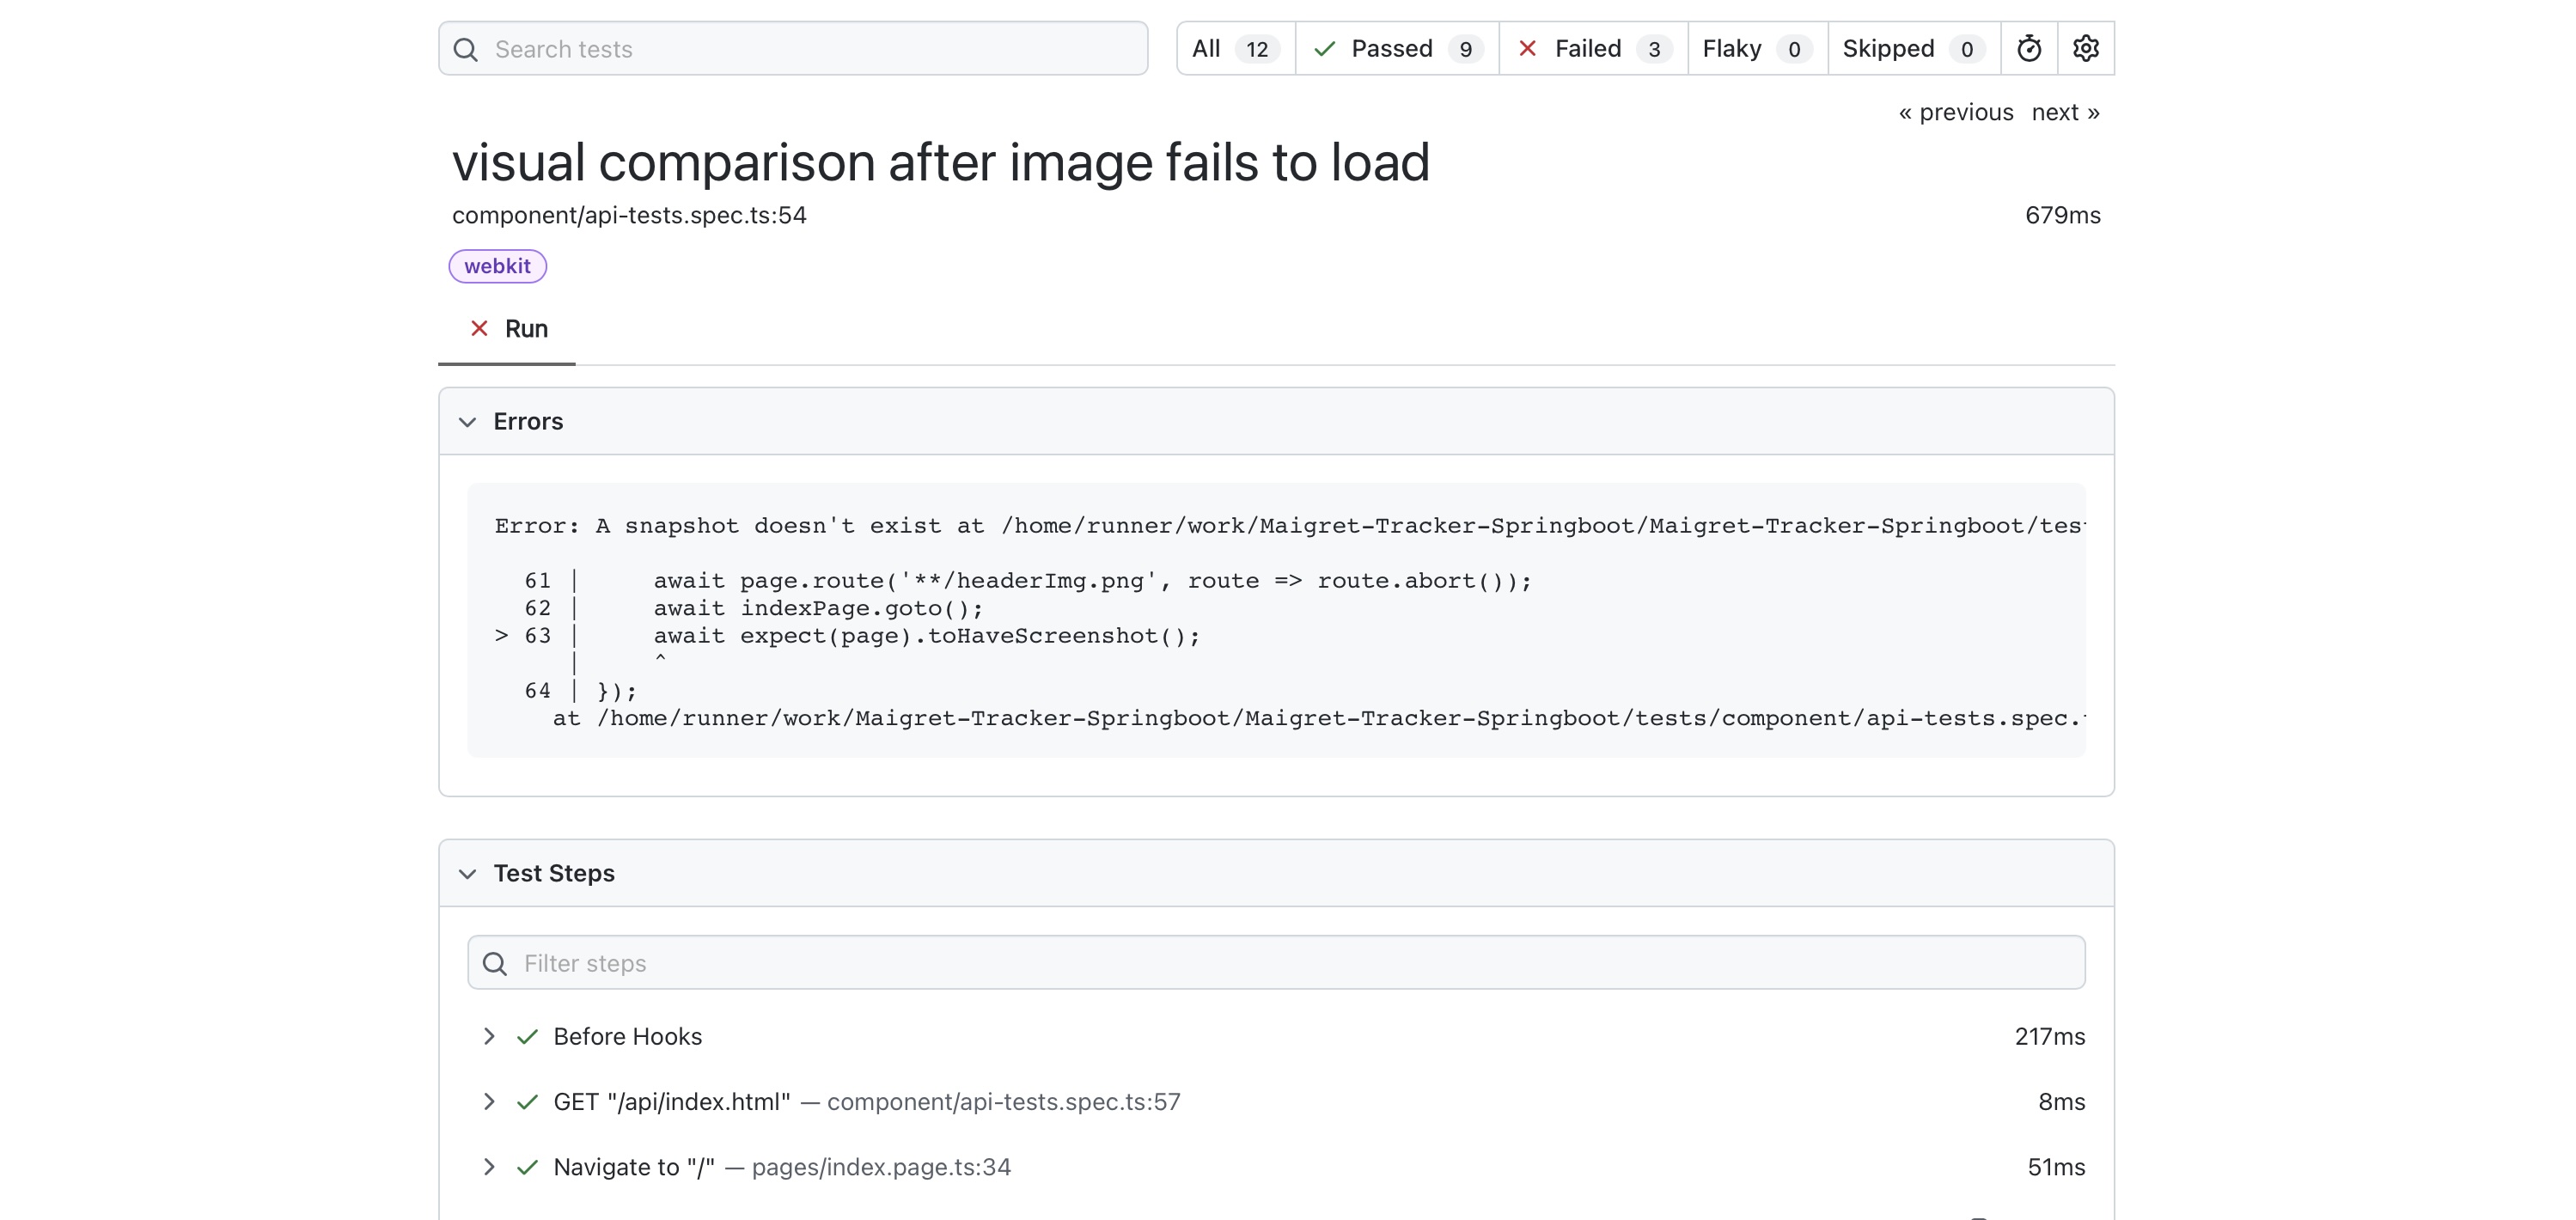
While this current app is a basic html page, in a project with user stories related to formatting a web page, i.e. verifying font, layout, colour etc. Playwright’s Visual Comparison tool enables test coverage to include visual verification that the page rendered meets the agreed acceptance criteria.
Playwright is able to generate an initial baseline screenshot of the target screen, and refer back to the ‘golden expectation’ image to compare the the screen generated during the test to verify it is exactly the same. I’ve used this tool in the test below to simply verify the app’s landing page is unchanged (as the icon, object layout etc.)
test('visual comparison example test',async({indexPage,page})=>{awaitindexPage.goto();awaitexpect(page).toHaveScreenshot();});
The first time this test is run the baseline screenshot does not exist, and an error message appears:
🛑 Missing Snapshot Error
A snapshot doesn’t exist at:
example.spec.ts-snapshots/example-test-1-chromium-darwin.png
This initial run saves the screenshot in a snapshots folder, and this is the ‘golden expectation’ future test runs will use to compare the browser window snapshot:
Now when visual comparison example test runs, it goes to the landing (index) page, and verifies the screen is exactly as per visual-comparison image in the snapshots folder.
If we change the image on screen- for example the first book title is corrupted to %Pieter^The L@tvian the image on screen is different to what is expected and the test fails as expected.
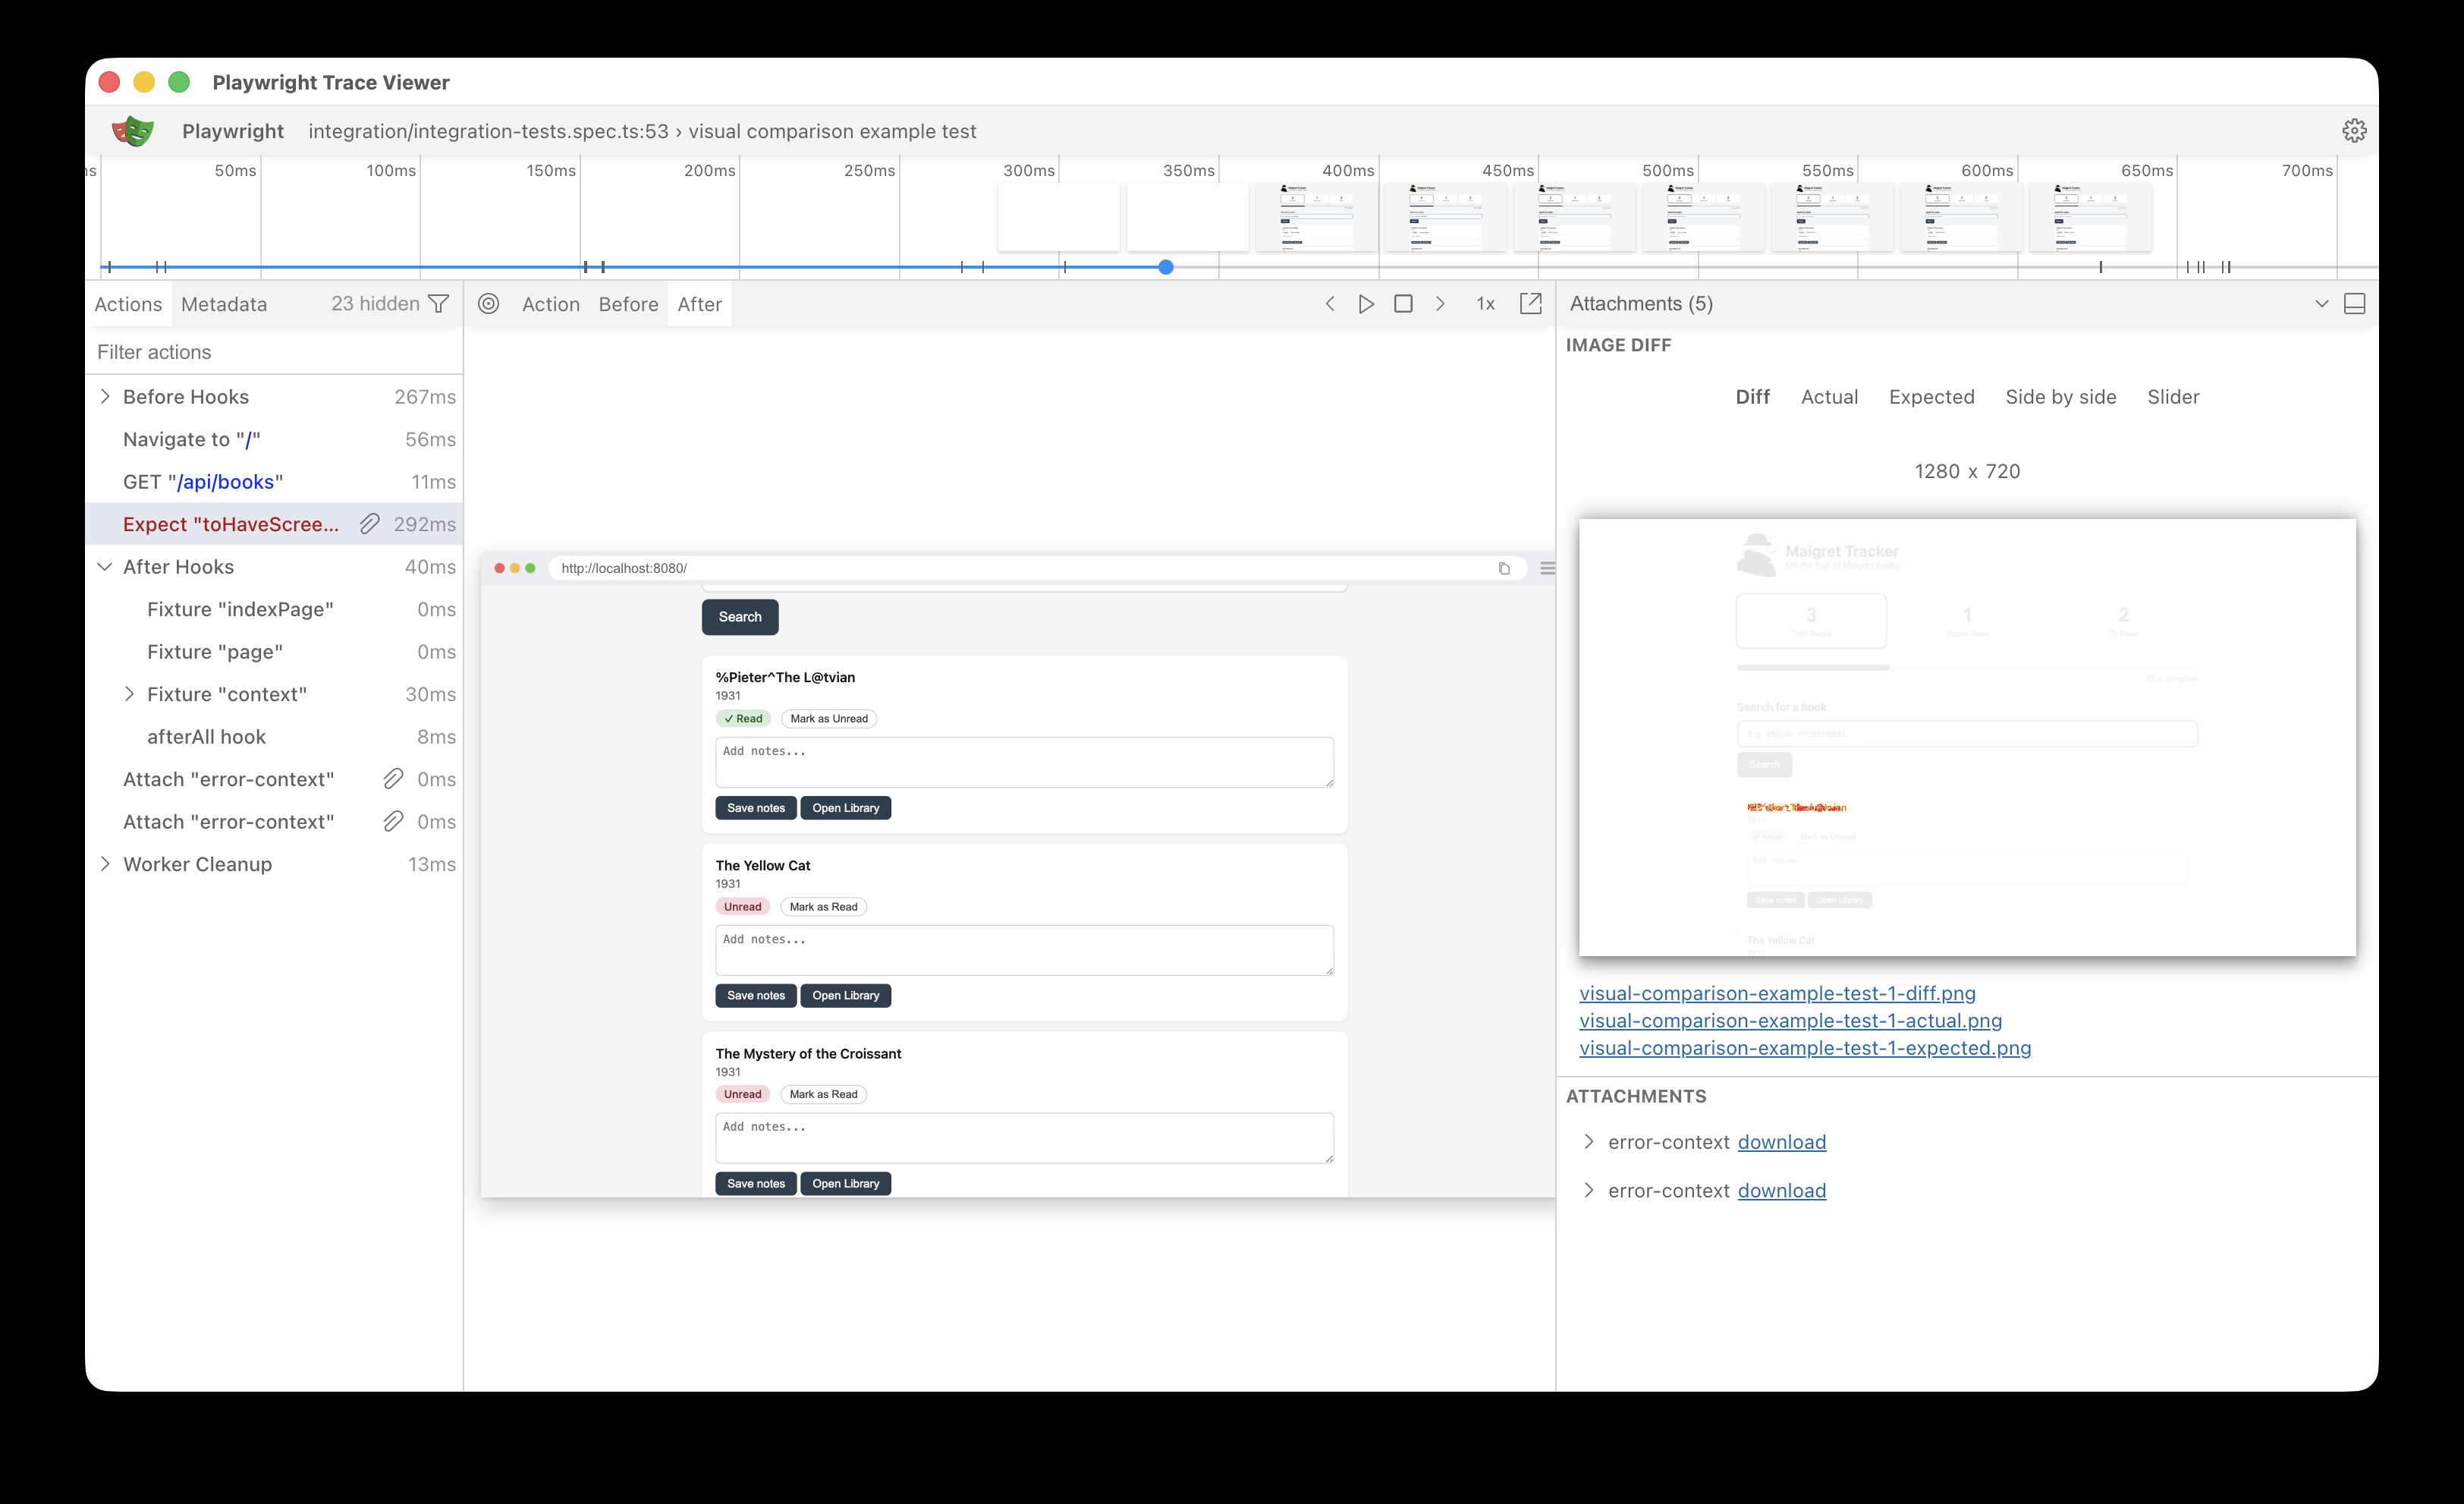
Trace viewer helpfully shows what the differences are:
This is a simple example which demonstrate the utility of the tool, practical use cases would be to verify page layouts, fonts, colours etc.
One caveat with this tool is the screenshot may vary from device to device (different resolution, browser settings etc.) so the recommended approach is to run these tests in a CI pipeline (so the environment, browser, OS etc. is stable and repeatable). These tests are applied to this project’s pipeline in the section below.
Frame Locator
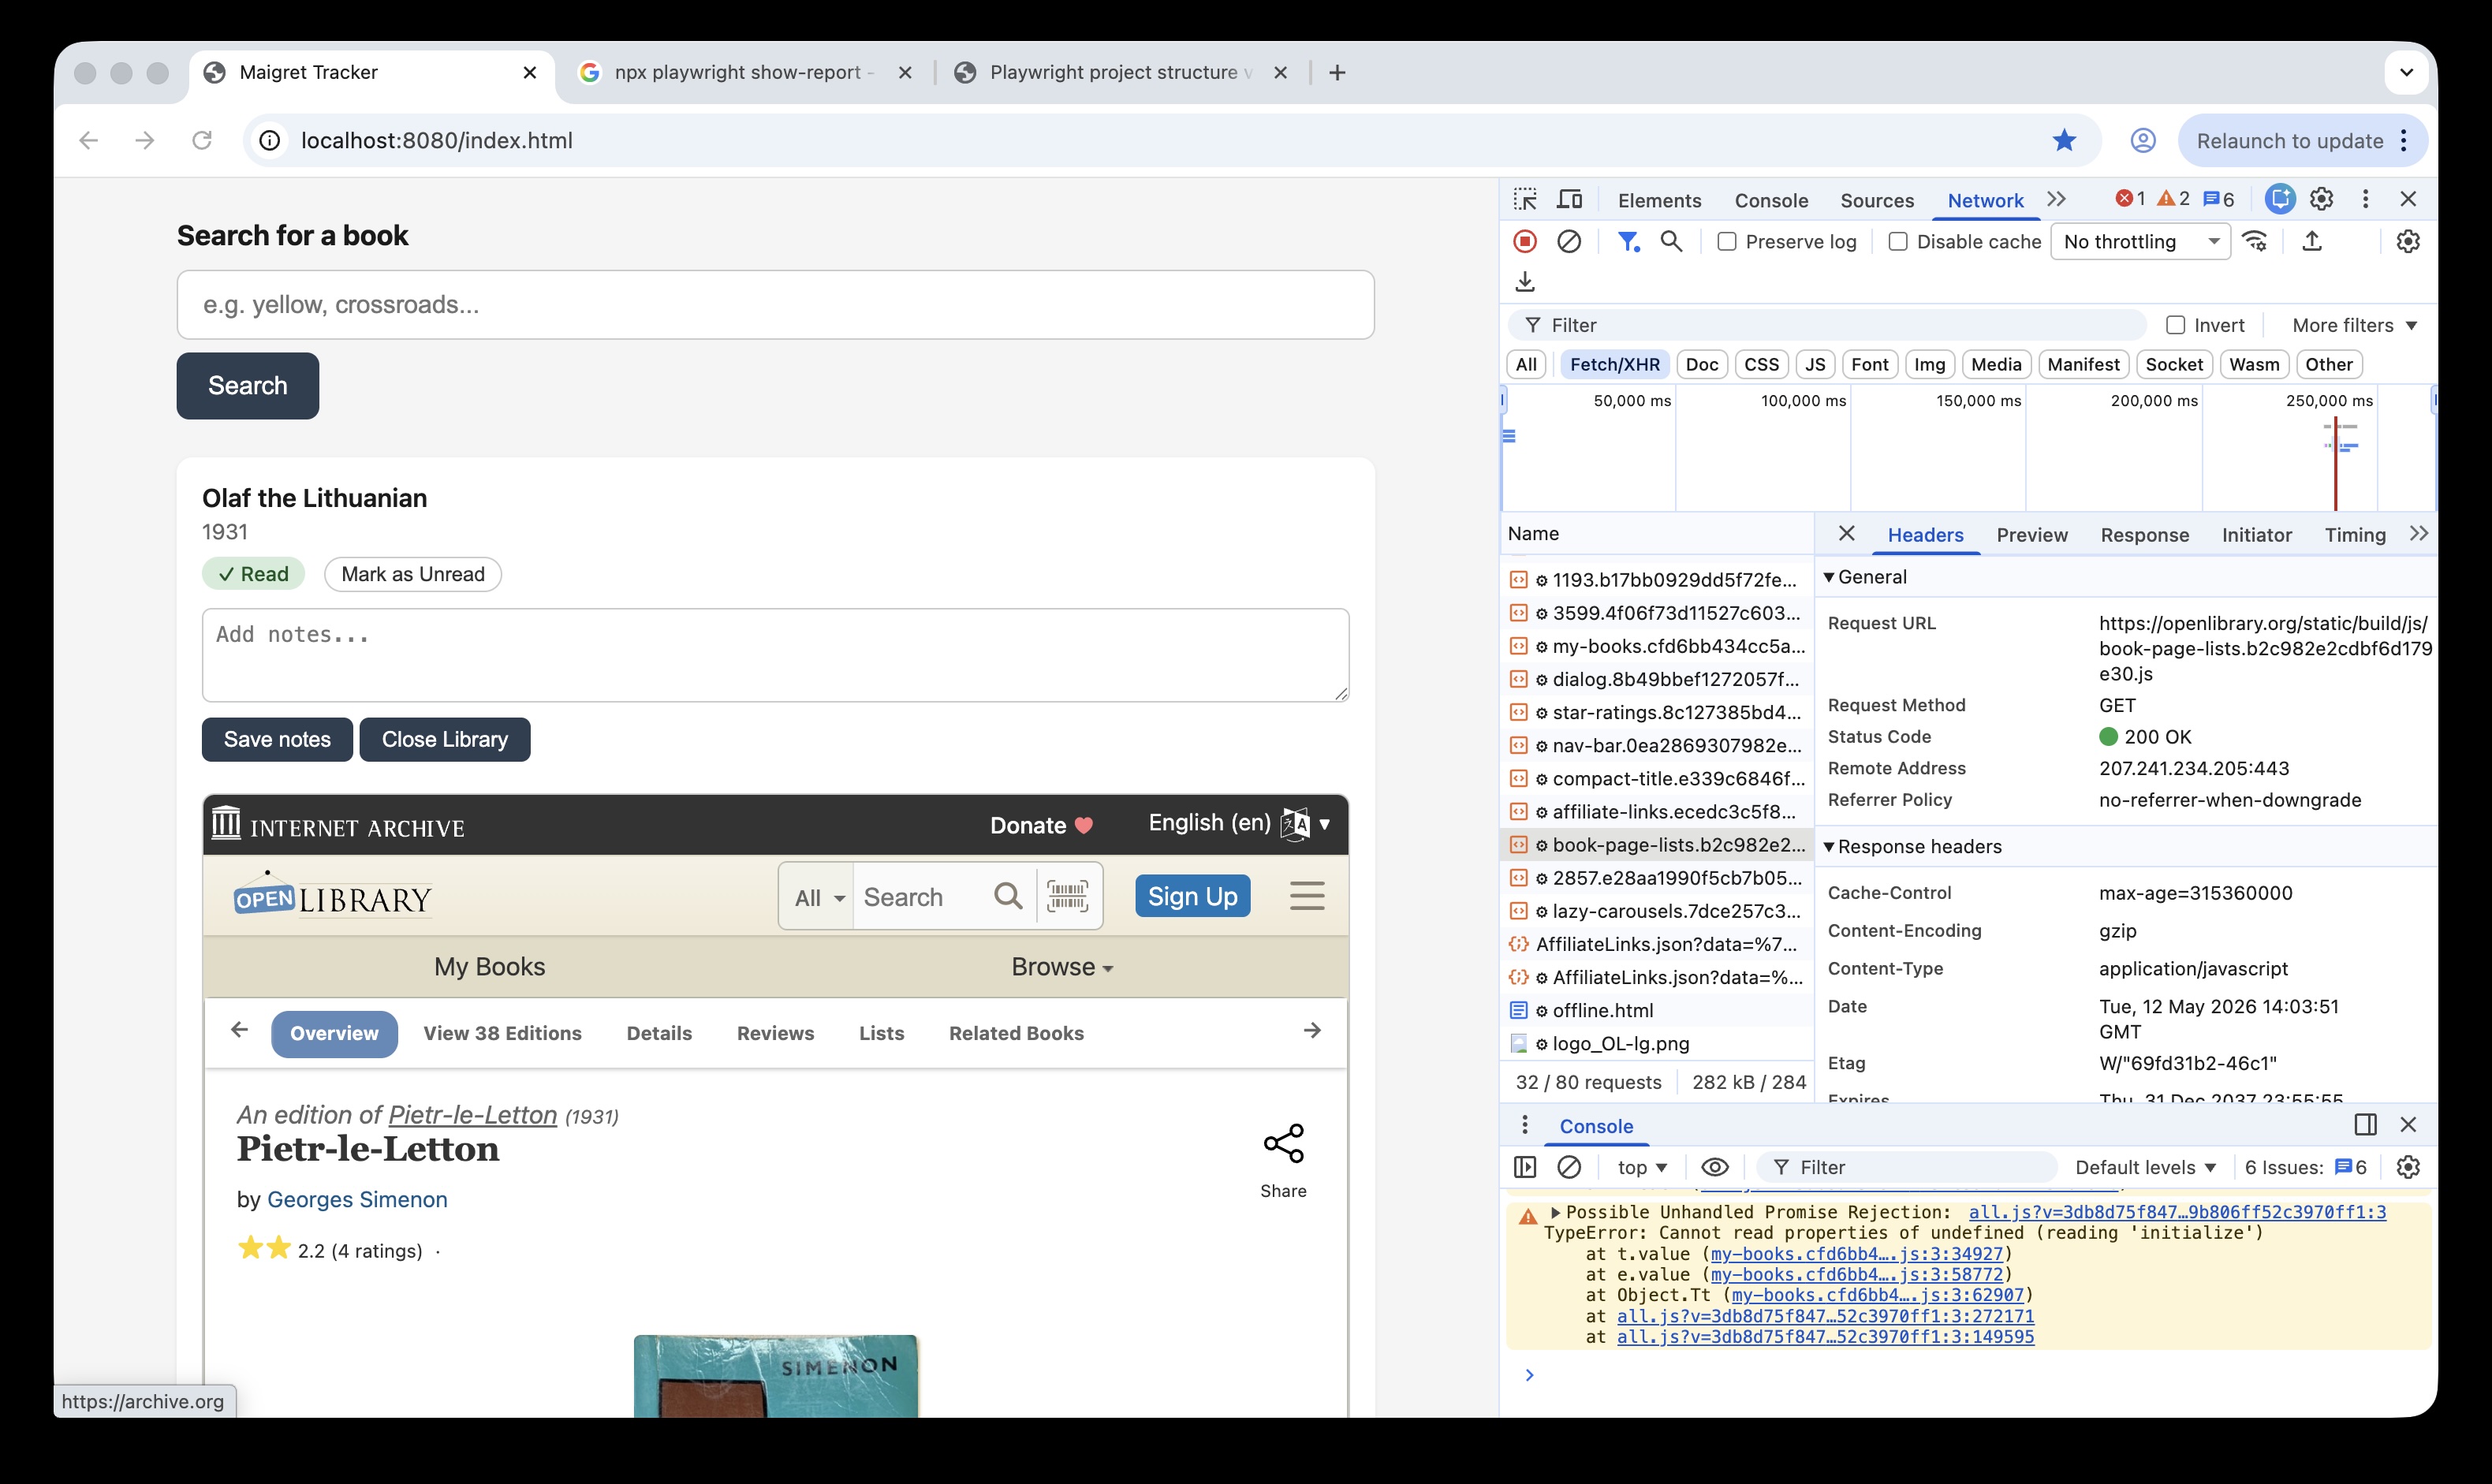
The web application displays book cards (book title, publish details etc) and also a button to open Open Library details about that book. That data is fetched in an iframe, i.e. another html page embedded inside the original web page.
This can represent a challenge when building ui tests (especially if there is a cross domain element), its effectively opening another browsing context within the existing DOM, which can complicate selectors.
However playwright has a useful FrameLocator class which scopes locator access to within that frame, so they can be accessed within the parent page context.
Cross-origin iframes can be a challenge in other tools like Selenium, but Playwright handles them cleanly via contentFrame()— as this test demonstrates with an embedded openlibrary.org frame inside a localhost app. The test below opens an Open Library iframe for a selected book, verifies the content has loaded, and confirms tab interaction works within the frame.
test('opening the Open Library info for a selected book',async({indexPage,page})=>{awaitindexPage.goto();awaitindexPage.libraryBtn("Olaf the Lithuanian",'Open').click();// set const to get the iframe for the selected bookconstiframeLocator=page.locator('iframe[id="library-frame-Olaf the Lithuanian"]');// Wait until Open Library src is loaded into the iframeawaitexpect(iframeLocator).toHaveAttribute('src',/openlibrary\.org/,{timeout:10000});// contentFrame() returns a FrameLocator — gives full Playwright locator access inside the iframeconstopenLibraryFrame=iframeLocator.contentFrame();// verifies the book card has loaded the Open Library logoawaitopenLibraryFrame.locator('img.logo-icon[alt="Open Library logo"]').waitFor({state:'visible',timeout:15000});// verifies able to use elements within the iframe to interact, click and change tabsawaitopenLibraryFrame.getByRole('link',{name:'Details'}).click();awaitexpect(openLibraryFrame.getByTitle('Book Details')).toBeVisible();})
In a CI/CD project, where many devs and QAs are pushing code to the main branch, adding Playwright tests to the pipeline means that browser regression testing can happen automatically as part of code integration.
In this project, we have component and integration tests- note that other projects would also have an end to end folder (e2e) which would cover user action tests (e.g. log in, add records etc.) but for now we will add the component and integration tests to the CI pipeline.
Configuring the tests to run in a CI pipeline
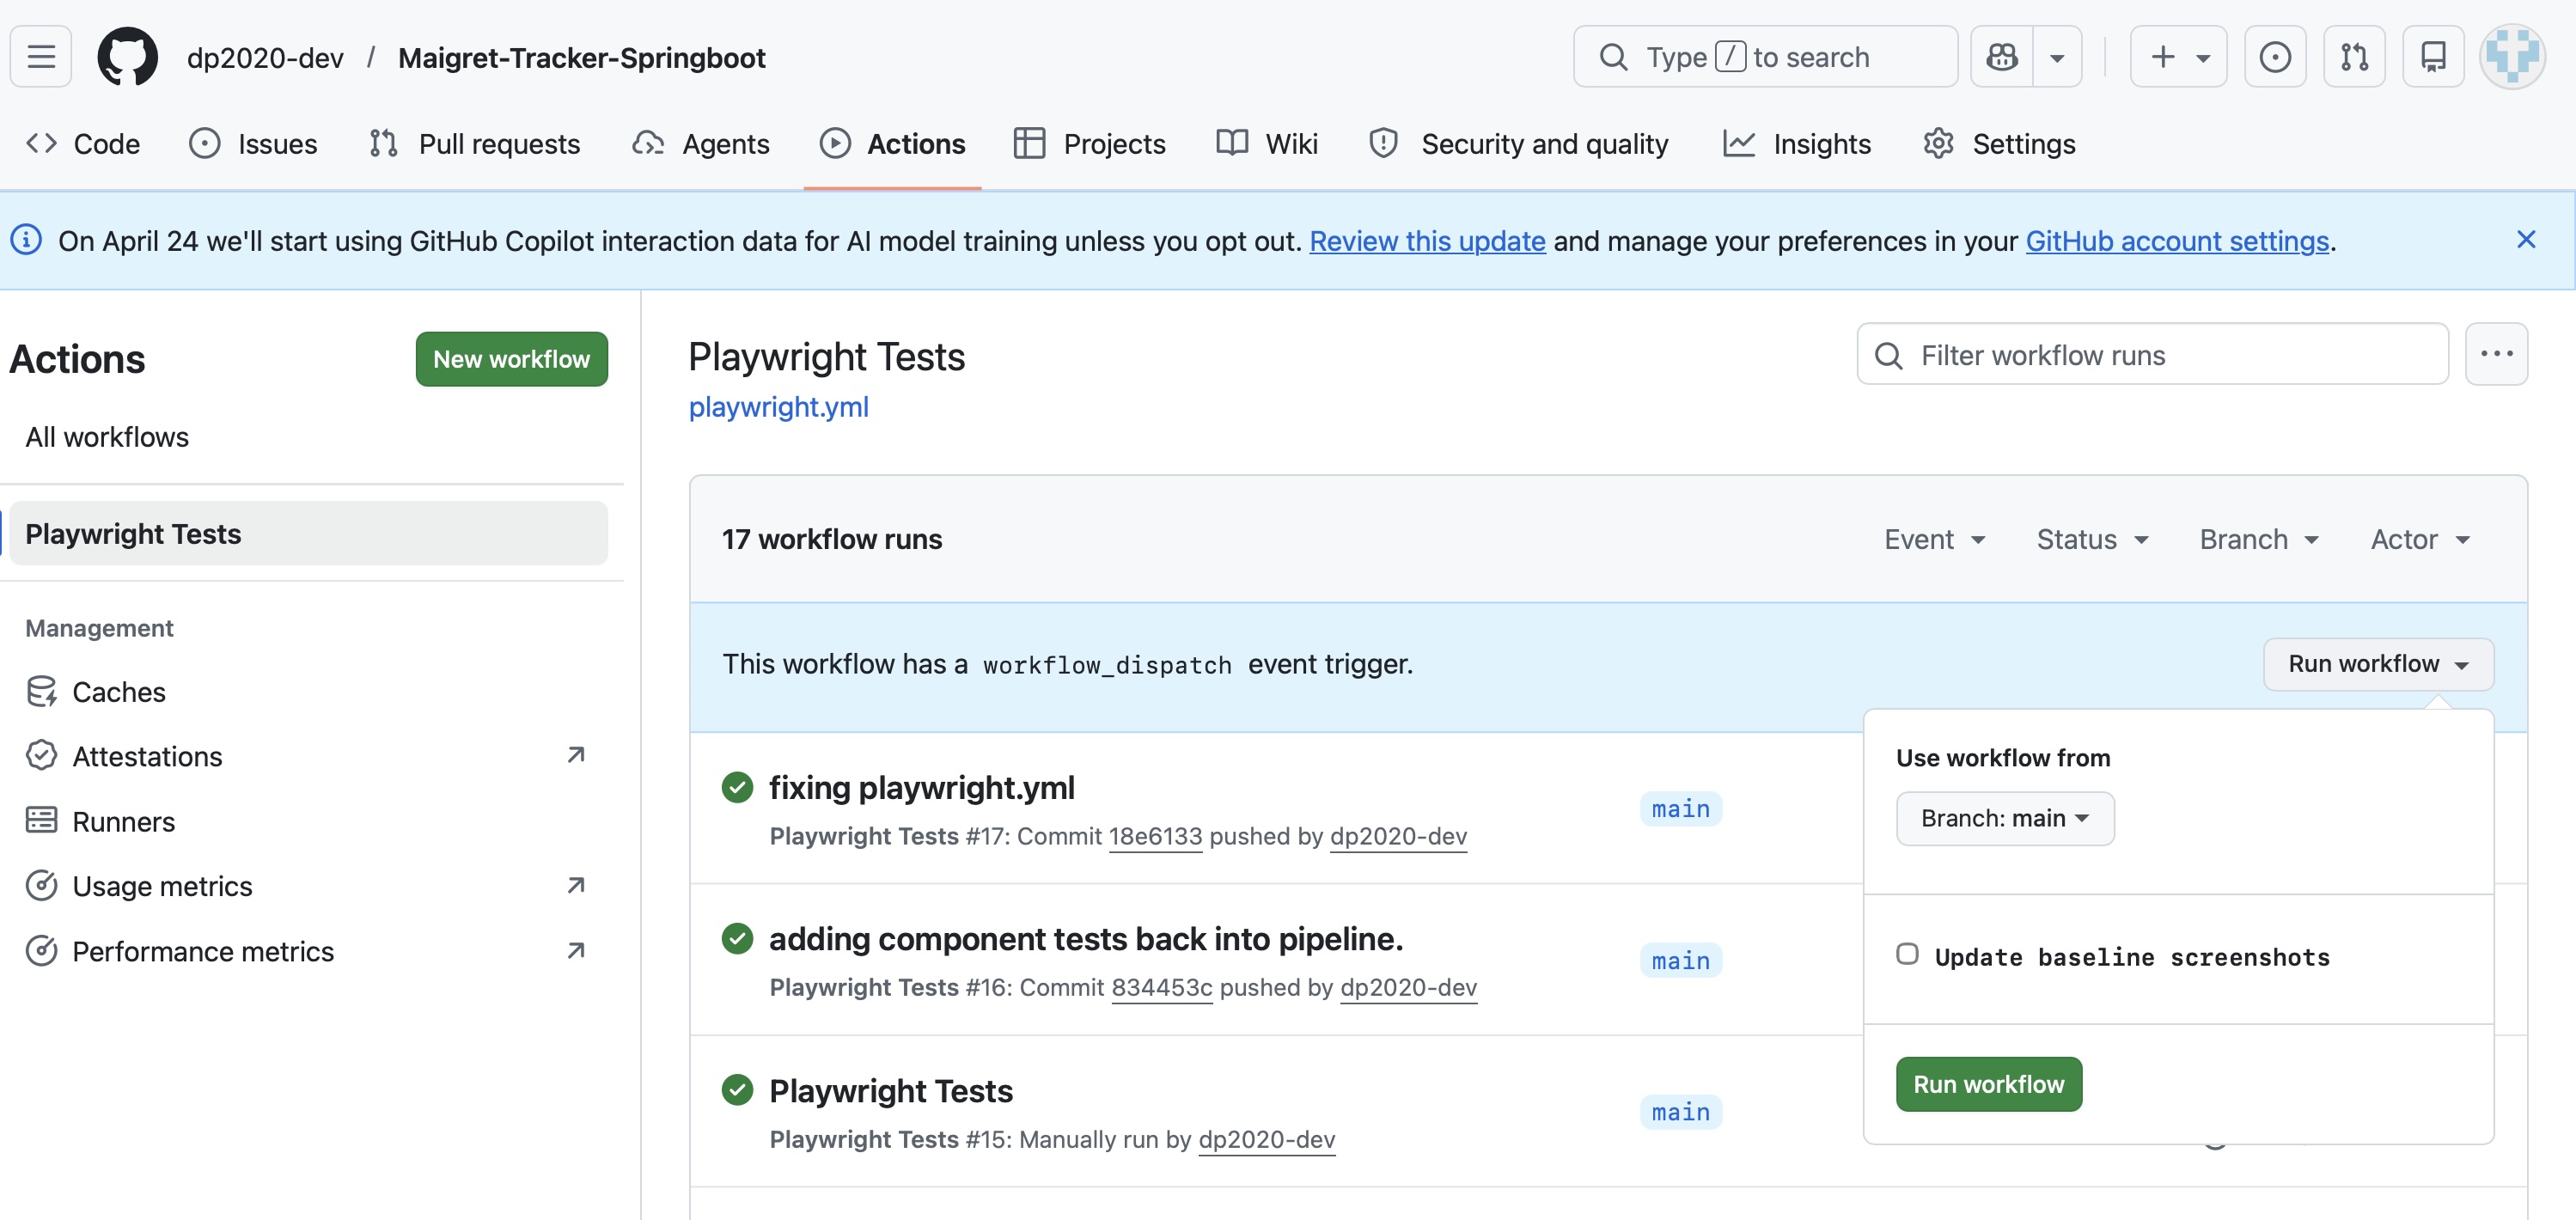
For this project, the CI tool is GitHub Actions, and to incorporate the playwright tests in the CI pipeline a yaml file is pushed to the repo to set up the test pipeline action. The following details are for GitHub, but the same principle applies to Azure and AWS, the relevant settings are applied in a yaml file.
For GitHub, the file is located in .github/workflows/playwright.yml. The full yaml file is located here and include the steps to download dependencies, the required browsers and other dependencies, but the following snippets are the key settings relevant to this project:
branches specifies which cloud repo branches will run the tests:
Run Playwright tests specifies which set of tests to run (a project may have tests which are only runn locally, so can be excluded here):
-name:Run Playwright testsrun:npx playwright test tests/component tests/integration
Running the visual comparison tests in a pipeline, updating baseline screenshots.
Given the visual tests are good candidates for regression testing, and require a stable environment to ensure the comparison is like for like, it makes sense to include them in the pipeline tests. In this project, the tests are included in the integration test class.
<!–
Initially, the visual comparison failed in the Github pipeline, as it doesn’t have a baseline image to compare with:
–>
To add the initial baseline screenshot, or to update it if the screen/page has been updated, run the following bash command and then commit/push:
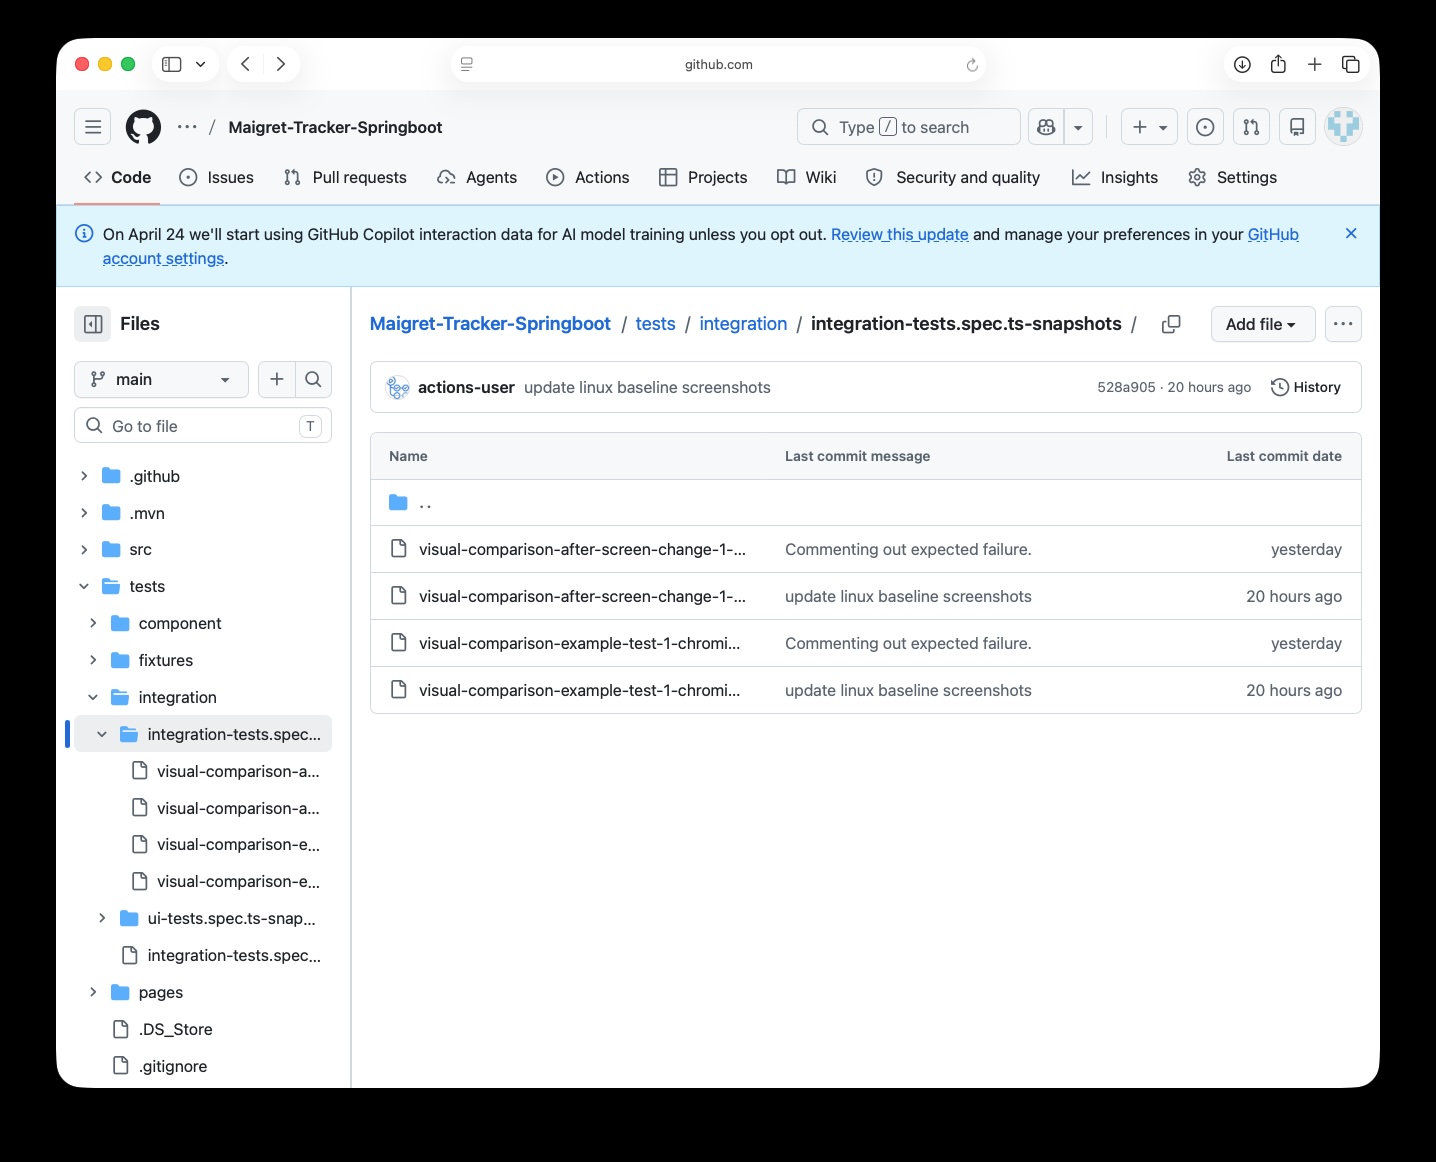
npx playwright test tests/integration --update-snapshots
This saves the baseline images from a successful test run in tests/integration/…snapshots:
The images are then updated and the visual comparison tests pass in the pipeline:
Summary
This example project proved an ideal opportunity to apply an initial Playwright structure using Playwright POM model (with abstracted pages and fixtures). My advice when applying a Playwright framework is to look at the system under test and map that structure to the Pages model, the file structure example above and the Playwright documentation will help guide on best practice on placing the related files from there.
This post also covered some of the classes and tools available in Playwright, this is just a sample but the page.route for APIs, the frame.locator and image comparison are good examples of productive, useful tools which make Playwright a productive tool for the test automation engineer.
The post gives a summary of the different types of data tests that can be applied to a data transformation project, including the use of dbt-expectations. The content is based on a dbt bootcamp course, with examples and explanations as to what’s being tested and how. The examples are available in Github:
From my experience with data transformation projects in the past (e.g. moving data from on prem to the Azure cloud) I’m aware of the challenges of ensuring the quality of data taken from multiple sources into target tables, the transformations at each stage and maintaining this quality continuously in a CI/CD delivery. This complexity makes manual testing onerous (especially given the transformations are likely to be part of an automated pipeline), with an underlying risk that errors in the end data can erode the user’s confidence in the data being consumed.
Given this context, being able to create efficient, discrete scripted tests at the key stages of a data pipeline using sql and built in dbt tests are a powerful, efficient way to ensure data quality throughout a data transformation project. Great Expectations.io and the dbt-specific version dbt-expectations offer a user friendly framework to further extend test coverage.
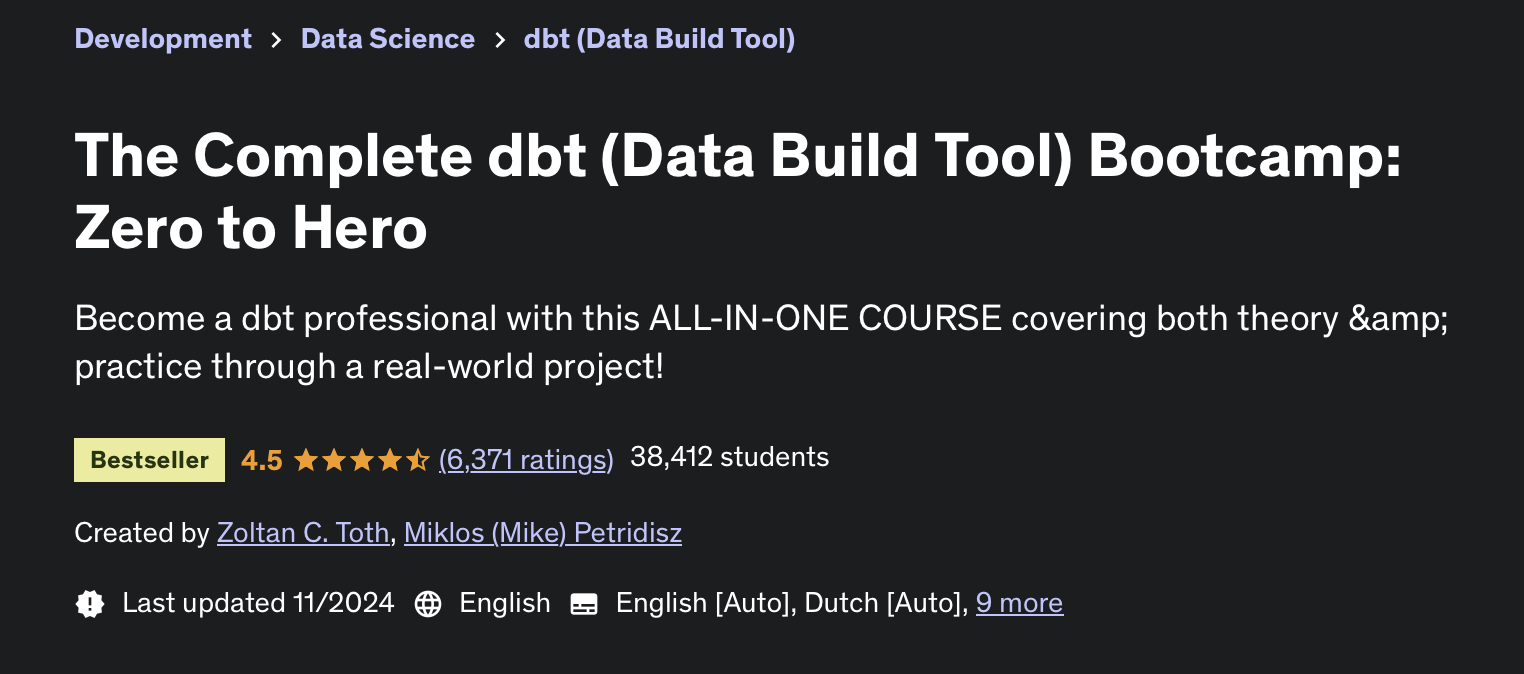
To see these test tools (dbt tests, gbt-expectations and custom sql tests) in action the following Udemy ‘bootcamp’ course was an excellent introduction to dbt and its test tools, and the screenshots and material in this post are based on this course:
The boot camp covers the theory and practical application of a data project using snowflake as the data warehouse, and the open source version of dbt. What was particularly relevant for a tester are the sections covering testing which include dbt expectations.
The following section covers examples and explanations of what these 3 types of tests can do, using the boot camp project as an example:
Built-in dbt Tests:
not_null: Ensures that the column doesn't contain null values.
unique: Verifies that all values in the column are distinct.
relationships: Checks if a foreign key relationship exists between two columns in different models.
accepted_values: Ensures that the column only contains specific values from a predefined list.
positive_value:</b> Verifies that the column values are positive numbers.
Built-in dbt-expectations Tests:
What is dbt-expectations?
dbt-expectations is an open source python package for dbt based on Great Expectations, and enables integrated tests in data warehouses supported by dbt.
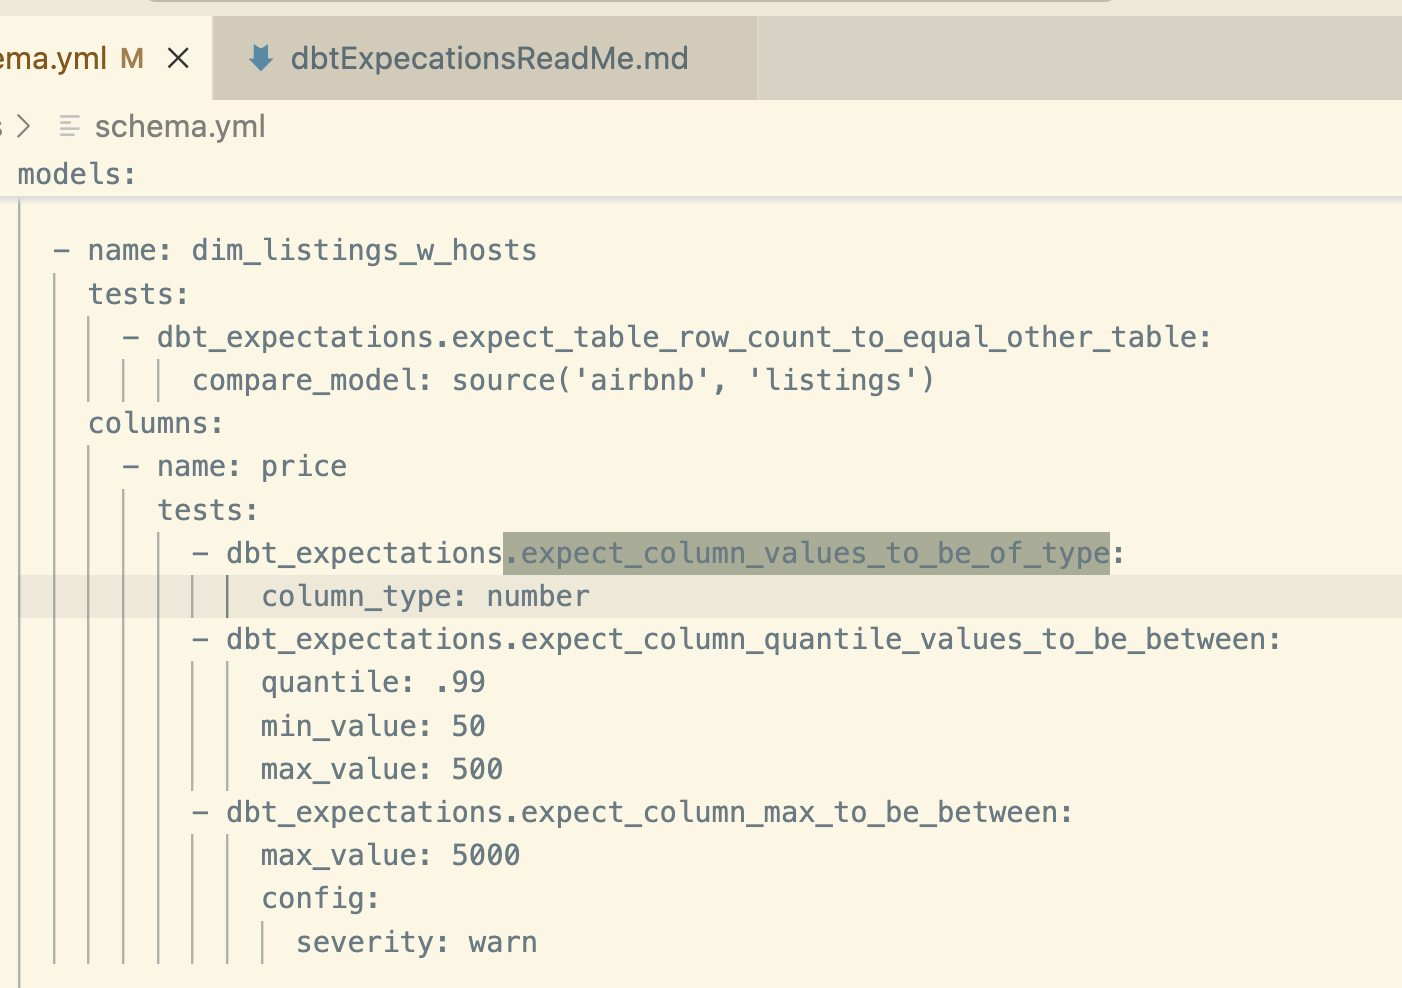
This allows us to extend the coverage of the dbt core (i.e. the built in tests) using a range of tests within the package. The examples below include the built in tests, dbt-expectations tests and custom sql tests (effectively macros). These tests are written in the schema.yml file as per this example in the schema file.
dbt_expectations. expect_table_row_count_to_equal_other_table: Compares the row count of two tables.
dbt_expectations.expect_column_values_to_be_of_type: Checks the data type of a column.
dbt_expectations.expect_column_quantile_values_to_be_between: Verifies that quantile values fall within a specific range.
dbt_expectations.expect_column_max_to_be_between: Ensures that the maximum value of a column is within a certain range.
Example dbt-expectations test:
To apply dbt expectation tests, the code is added to the schema.yml file
, in the example below its used to check column type, expected values (including the quantile value to check values in the table are in an expected range), and a max value. We can also set if a failing test is a warning or an error.
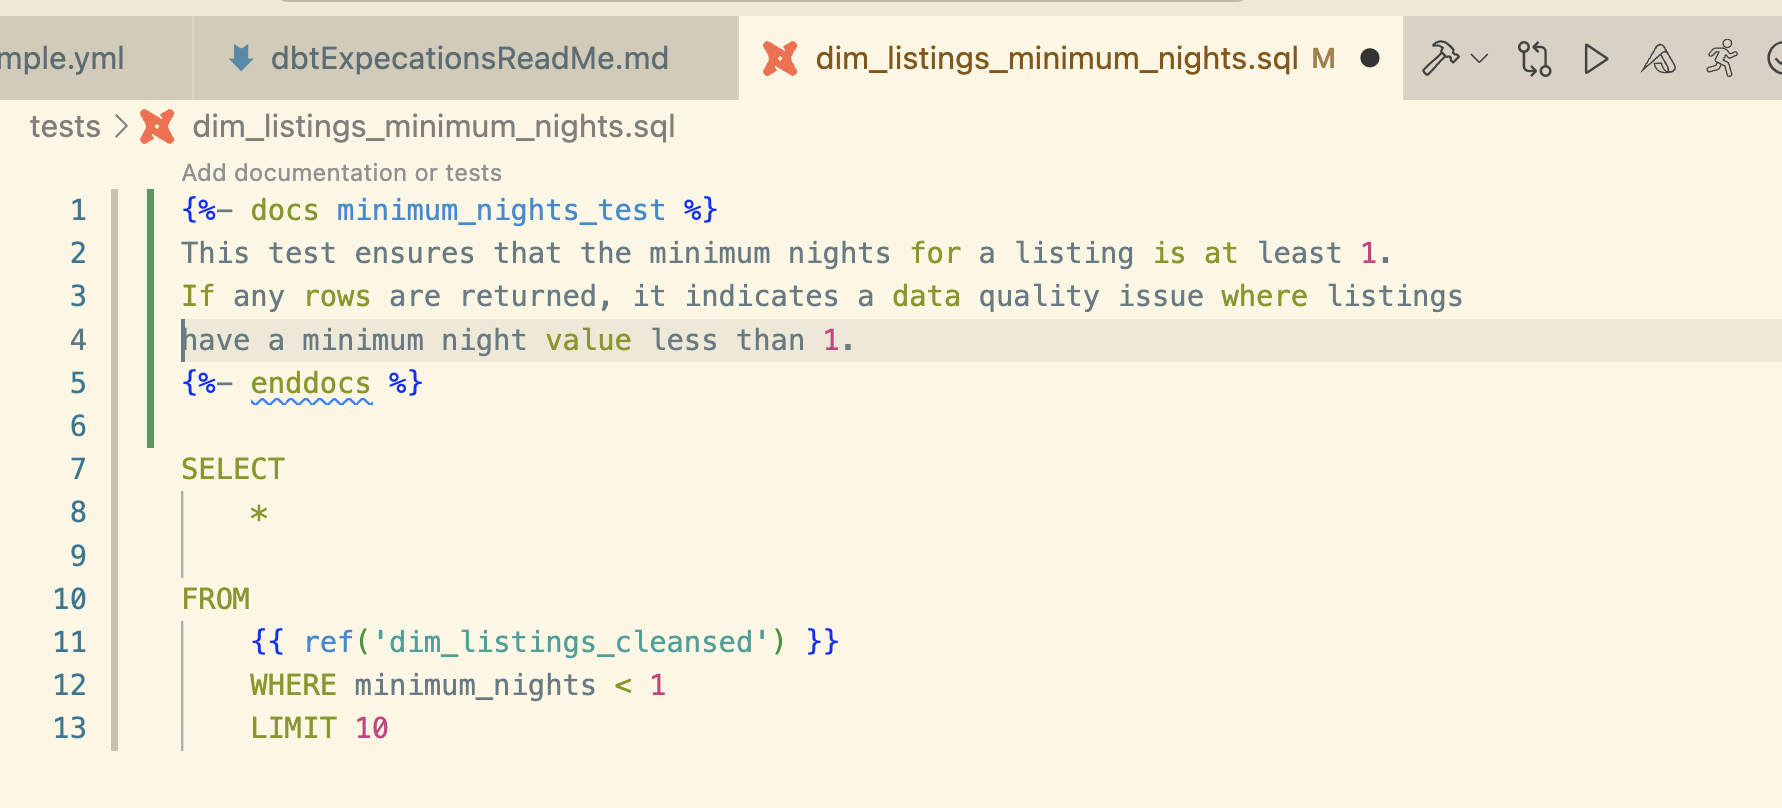
Built-in custom sql Tests:
The third type of dbt test used in this project is a custom sql test.
This simple sql custom test checks the ‘dim_listings_cleansed’ table for any listings with < 1 night.
Custom tests sit outside the dbt core and dbt-expectations tests and can
extend test coverage to cover edge cases. They are also flexible in enabling ad hoc testing to investigate
scenarios, or to be part of the CI/CD pipeline- see an example of how we can trace the dim_listings_min_nights custom rest on the data lineage graph in the lineage graph section.
Running dbt test --debug command will run all the sql tests against the database connections, the console logs all the test names and the results. However to dig into why a given test failed,
its possible to run the actual sql test against the source table (e.g. in this project in Snowflake) and simplifying the test code to find exactly where it failed- a good approach for a complex failure.
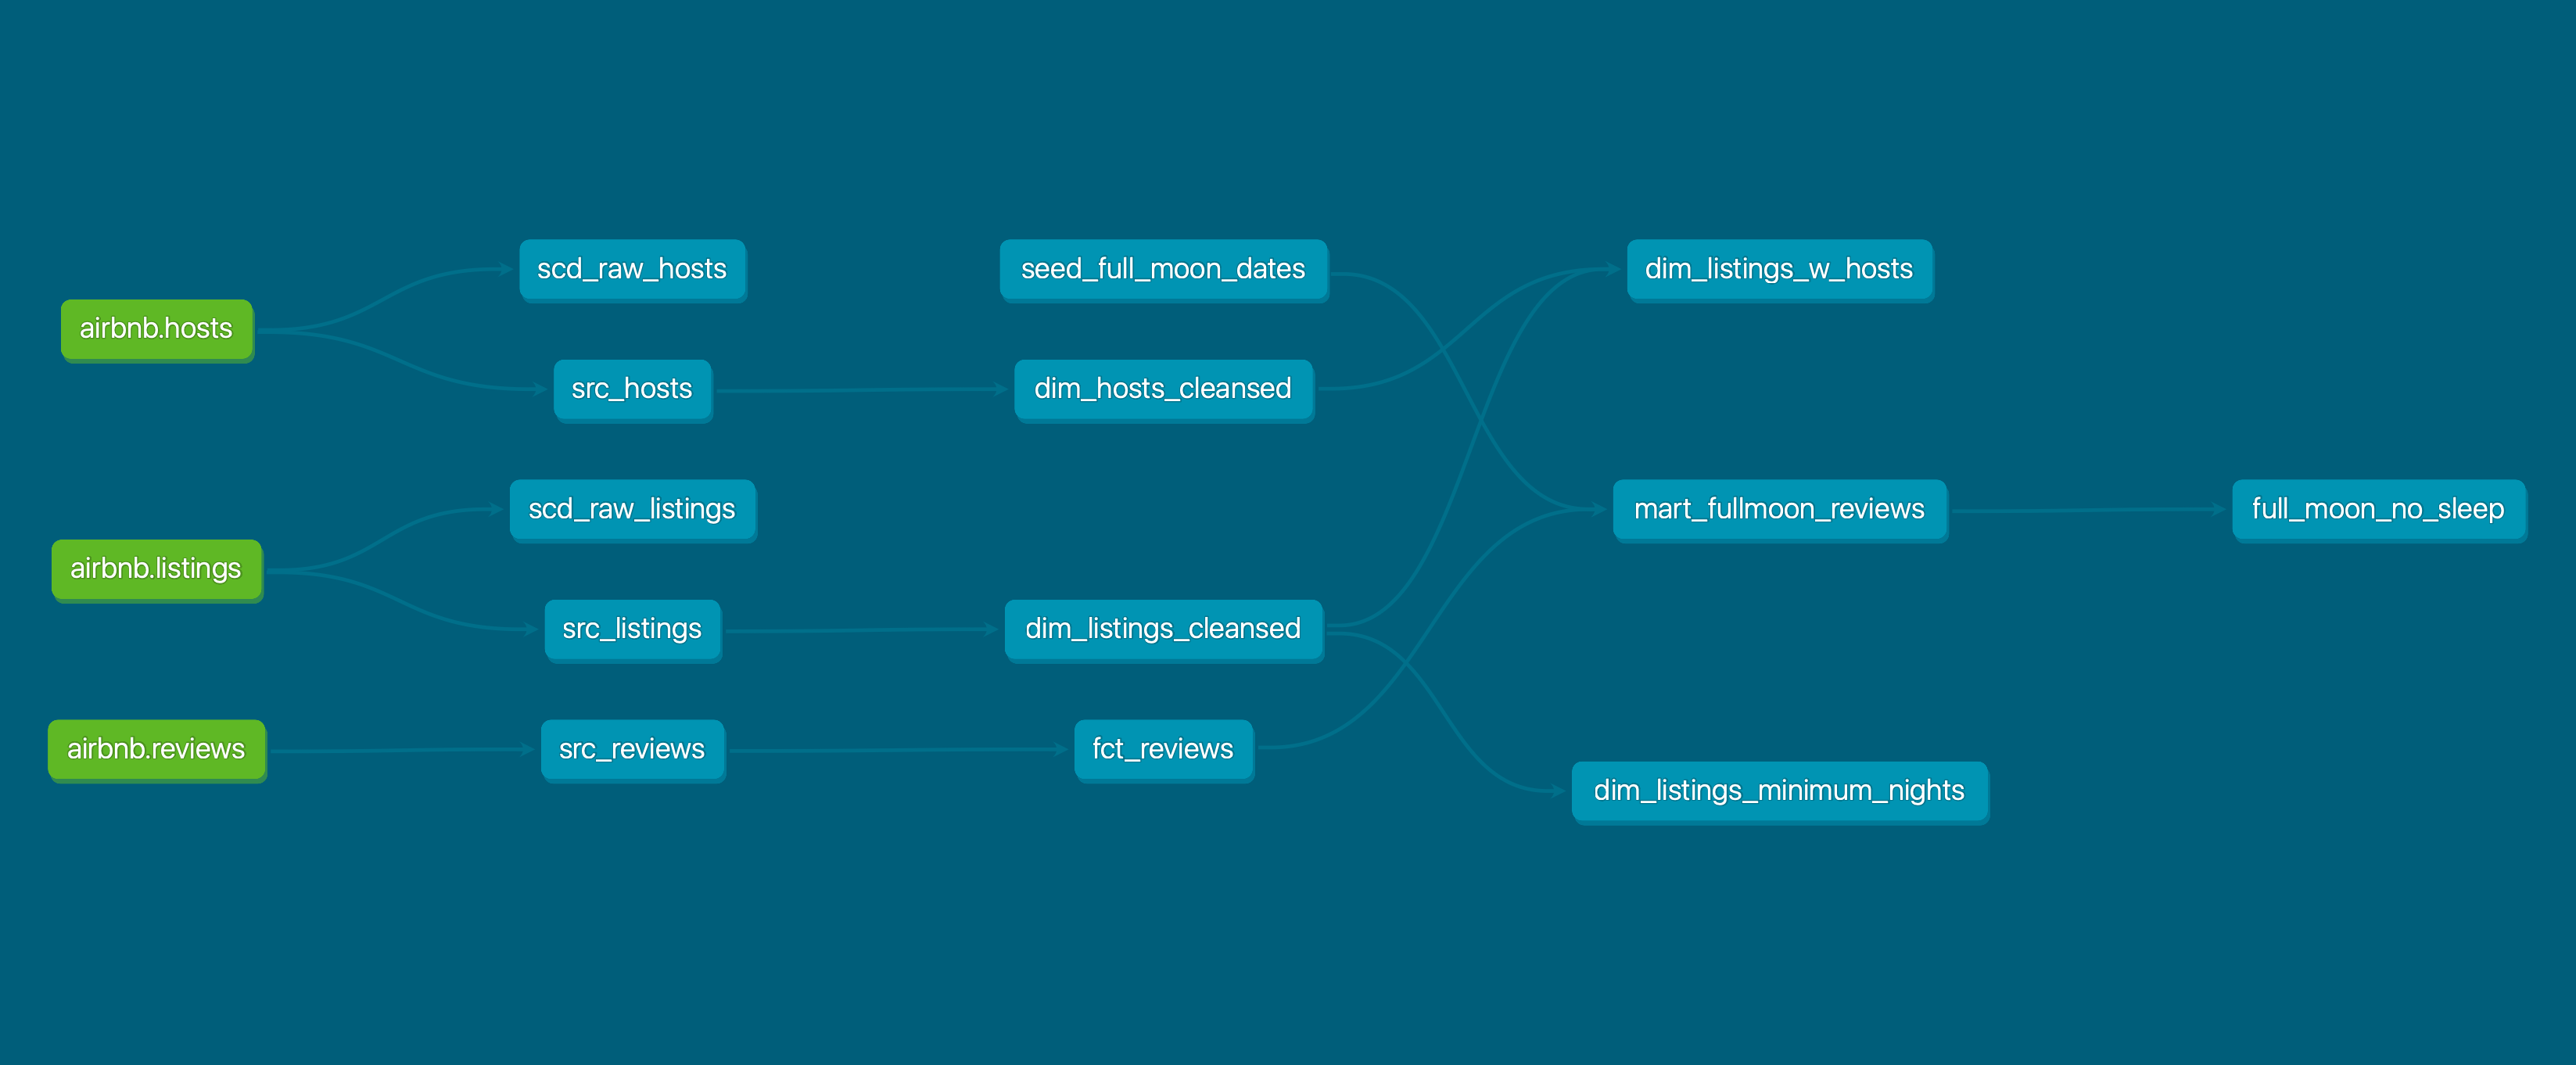
Lineage Graph (Data Flow DAG)
In the section above we’ve looked at practical tests in dbt-expectations which can be embedded in the data transformation pipeline. These tests can be included on a really useful dbt feature, the ‘lineage graph’ alongside the source tables, dimension, fact tables etc. to show where and when the tests run, what table it relates to etc.
Provided test in question is included in the schema.yml and has a description value, it will be included in the correct part of the data transformation flow.
For example, the lineage graph below shows the flow of data in our data warehouse, for instance we can see at a glance that dim_listings_cleansed is a cleansed dimension table based on the src_listings table.
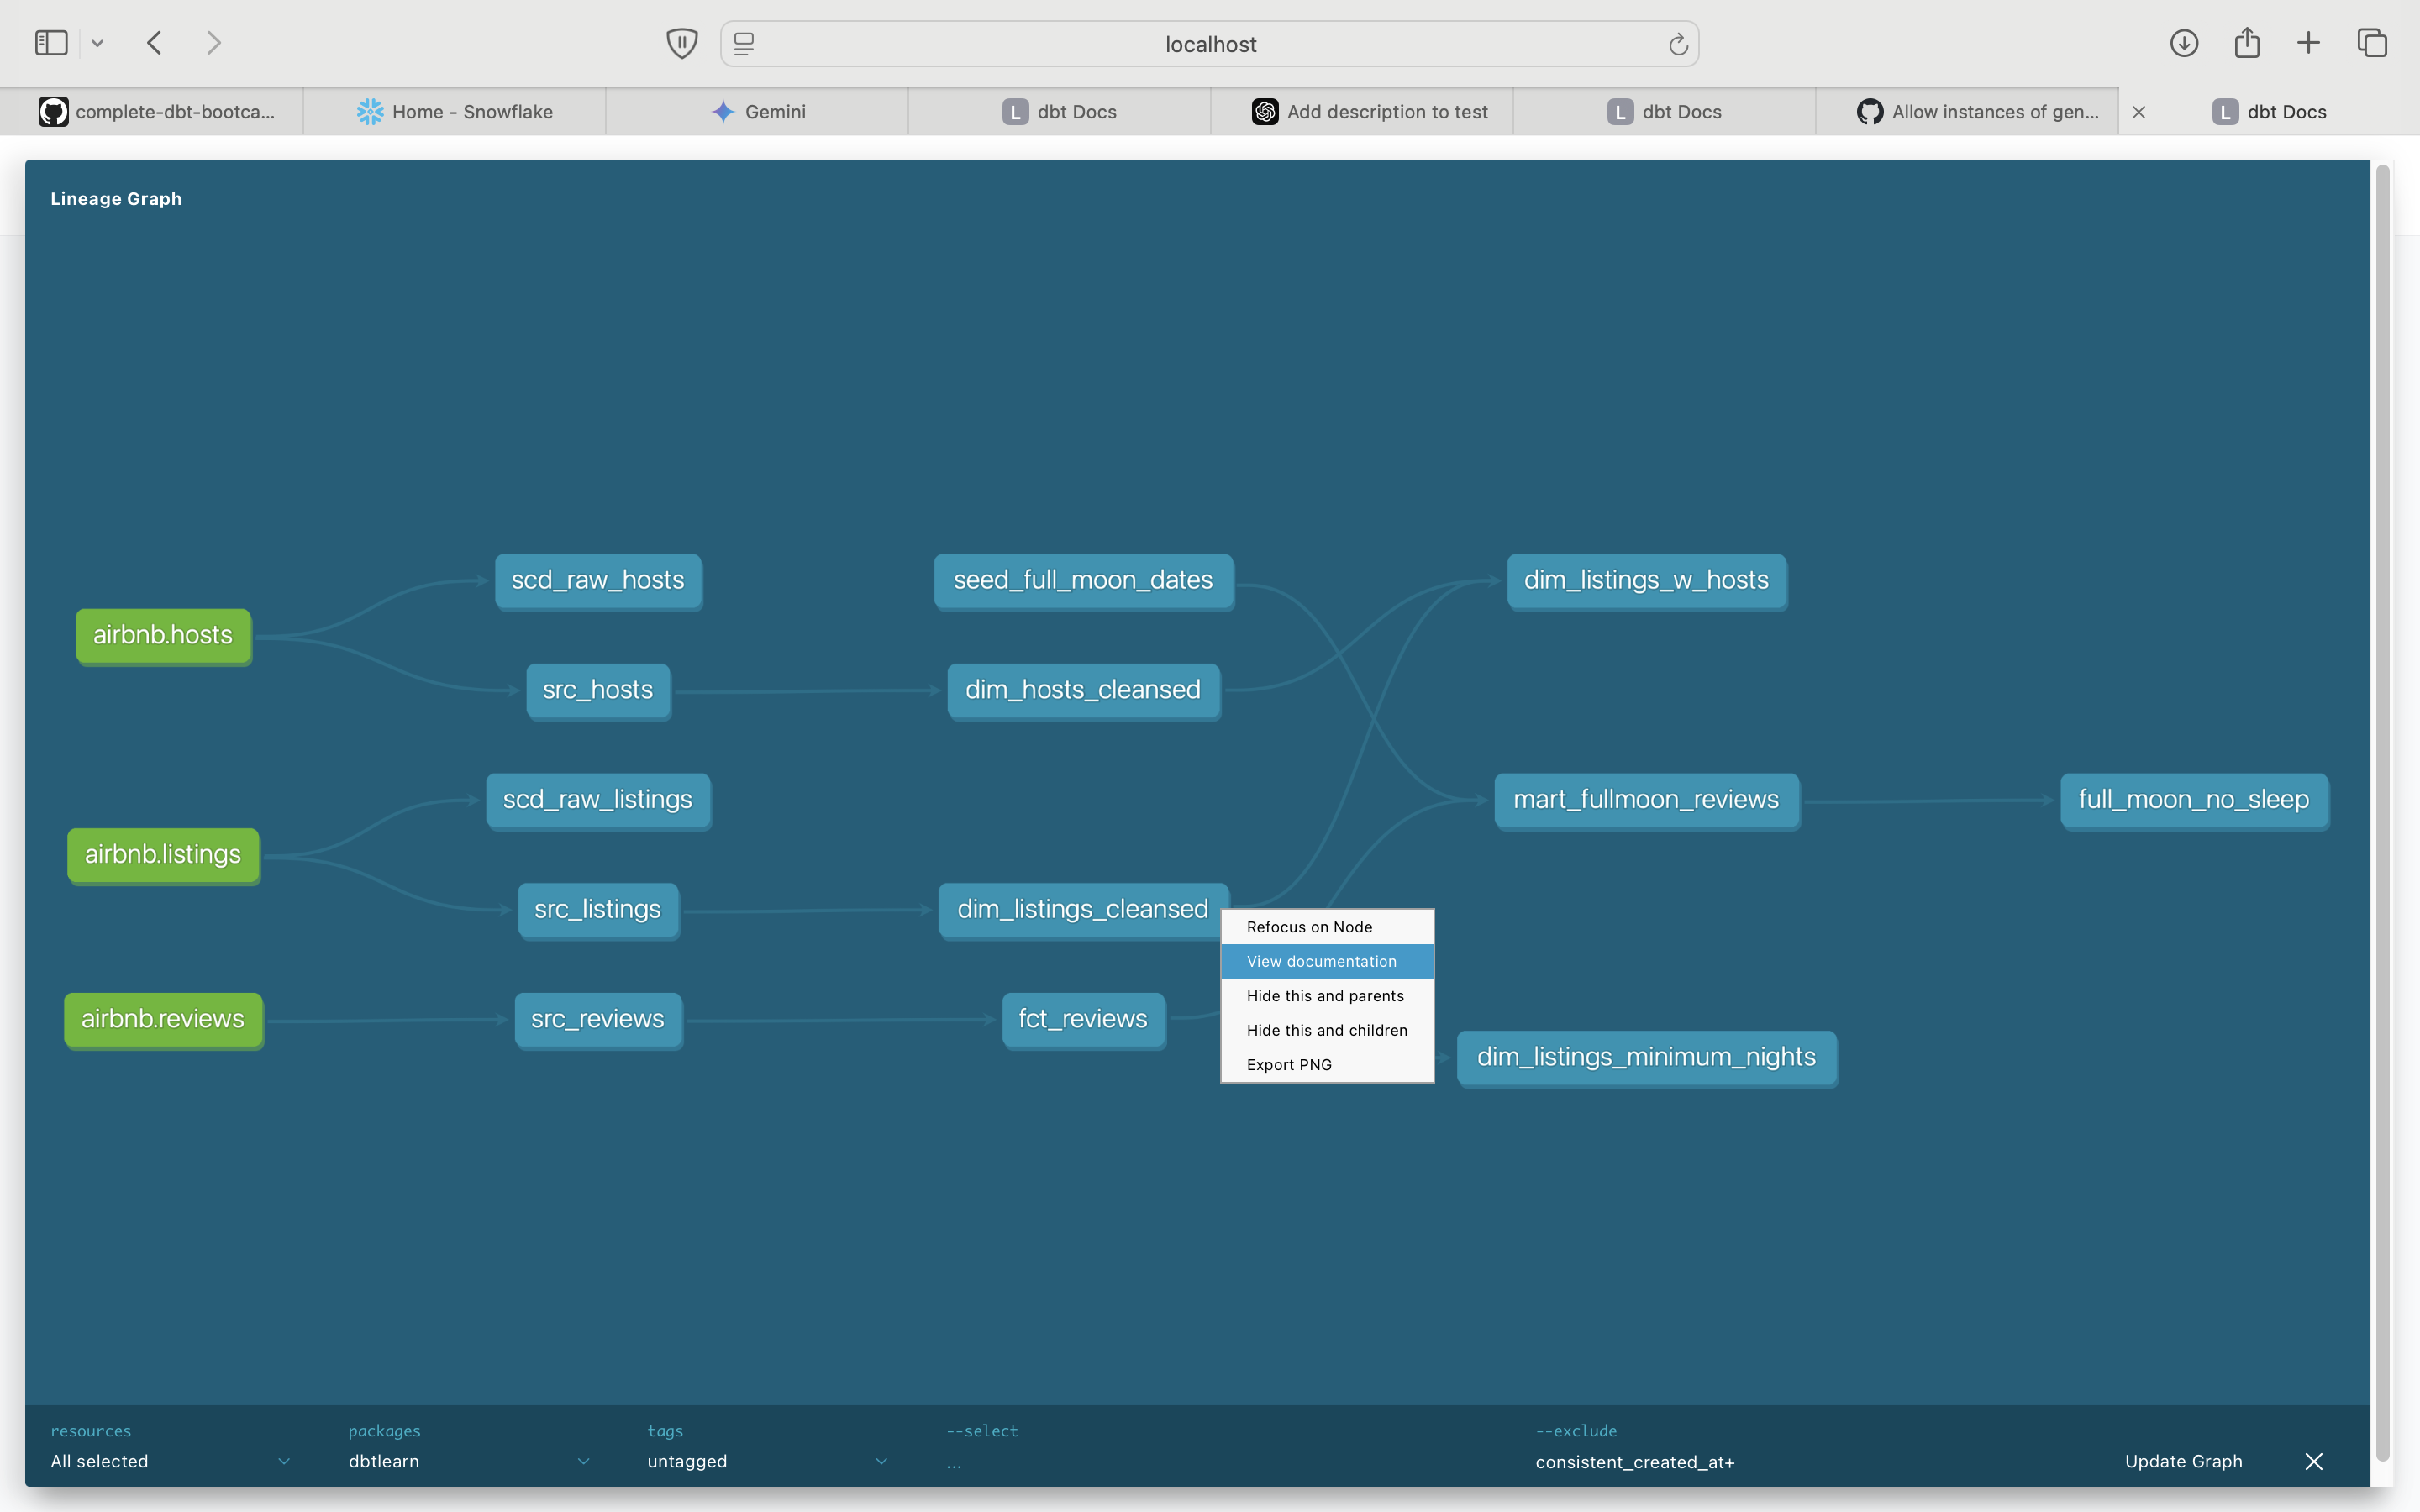
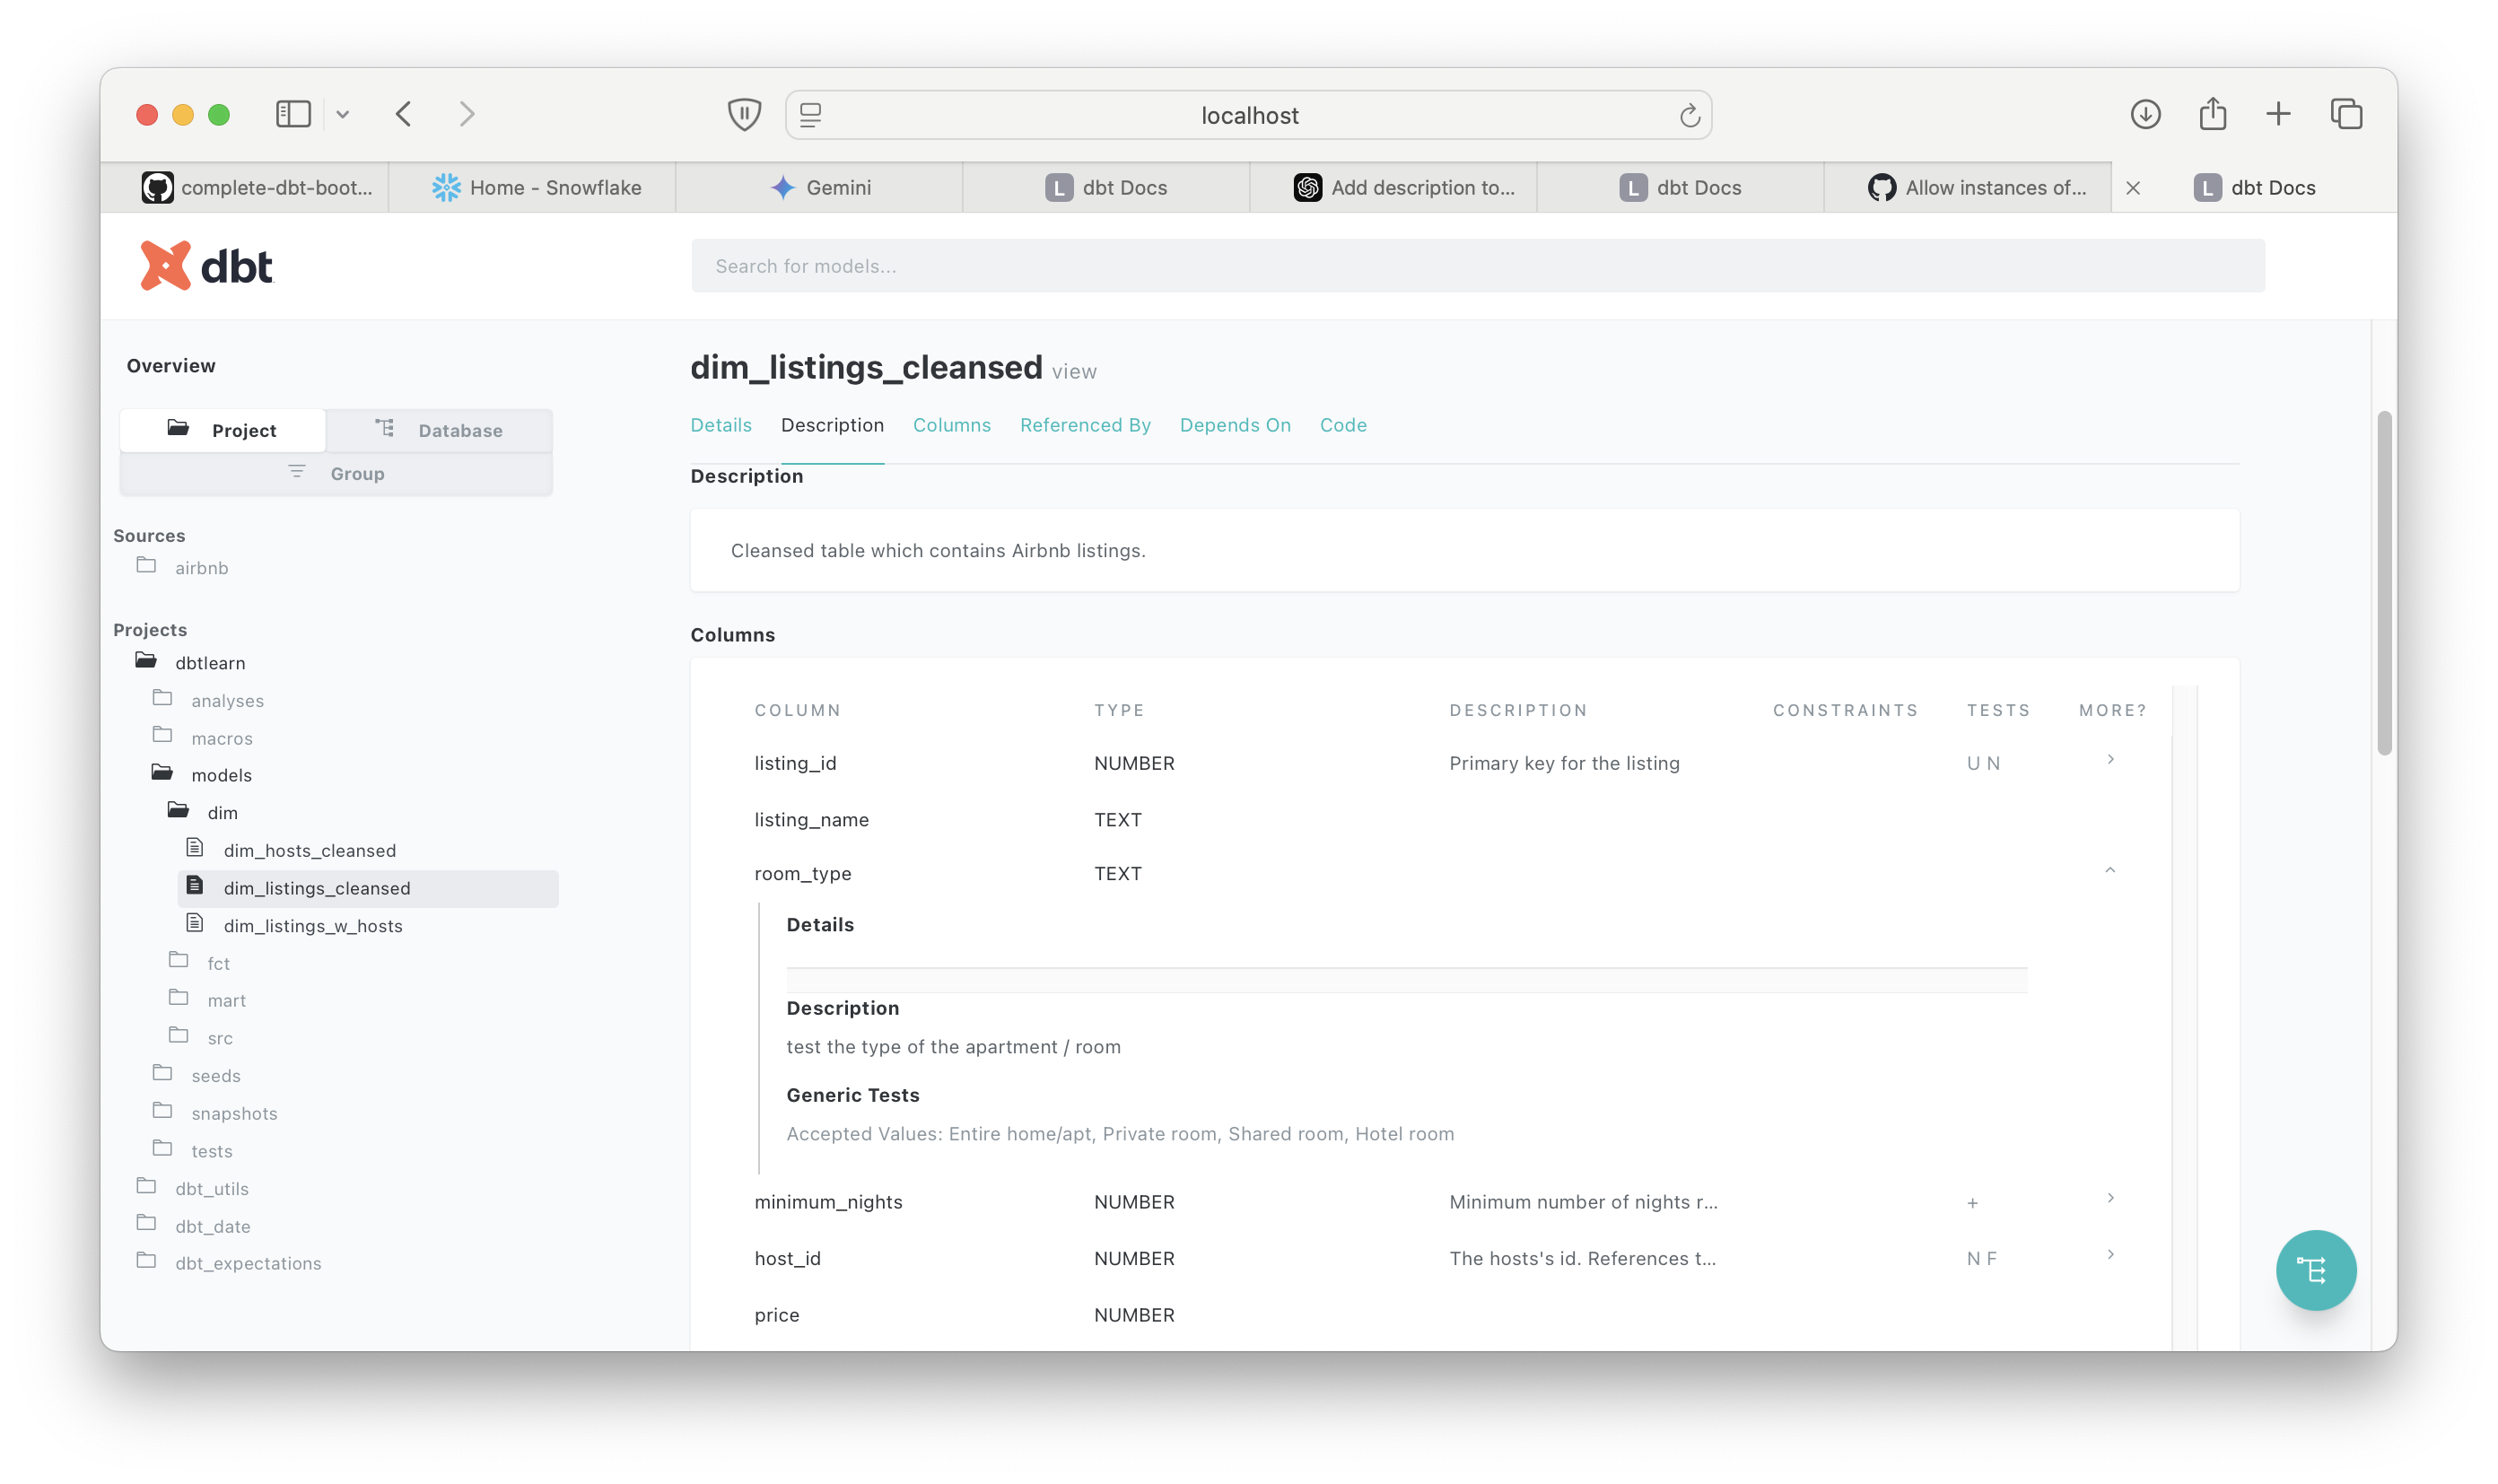
By right clicking and checking documentation for dim_listings_cleansed, we can check all the tests in place for this stage of the transformation, for instance we can tell the the room_type test checks the type of room as per the description.
For reference the test itself is a built in test in the schema.yml, and while the schema clearly lists all tests its great to be able to visualise where exactly this test sits in the data pipeline, what table(s) it references and we’re able to click through to read its description and code via the graph. In a data transformation with many sources/transformations this tool would be invaluable.
Summary
The different types of test tools used in this project has demonstrated how a tester can add value to a data transformation project. Firstly, the dbt core tests are simple, efficient sql tests at key stages of the data pipelines gives us assurance as the data is ingested and transformed at each stage.
Dbt-expectations allows us to extend the test coverage by enabling more advanced validations like expected percentiles, ranges, and more complex rules. For example the boot camp uses the expect_column_quantile_values_to_be_between test to flag a warning if a value in the top 1% of prices for a listing is outside a given range. This is a check for anomalies in the data based on our use case, dbt-Expectations in particular would be useful from a QA perspective- in collaboration with the end user/stakeholder a tester could start thinking of qualitative tests.
Finally, while not strictly speaking a tets tool/feature, I expect a tester would find the dag diagrams a really useful tool to keep track of what data is ingested where, how its transformed and which tests are applied to it.
I found there was some overhead to setting up the project structure so that the yaml picked up the right references, and that each of the 3 different types of tests were configured properly, but once up and running I was able to add more tests and extend test coverage. I started thinking of more potential validation tests using dbt expectations, so again these tools would empower a tester to work with the project/stakeholders to really start applying quality assurance not just to the data transformation itself but how its used by the stakeholders.
Note: this blog post is a summary of a talk I have delivered to test groups.
One of the most rewarding (and challenging) aspects of software testing is keeping up to date with the pace of change in the industry- from new test tools, changes in the technology stack or wider disruption, e.g. AI is a great example.
Therefore the ability to self-learn and learn ‘on the job’ is a key skill for a software tester, and with that in mind I’ve found utilising the 5W framework invaluable to take advantage of what ChatGPT or any other large language model (LLM) can offer.
Why do we need a framework?
This is a simple technique that forces us to think through what information and material we want from the LLM. This will give us a structure to both our prompts and the response we get back.
What is the 5W?
This technique is from an excellent blog by Tina Huang, and is originally based on learning a programming language but is equally applicable to test-related learning:
Apply 5 W framework to get a more relevant response (the example I’ve used here is to learn Selenium):
Who? What role does ChatGPT have- e.g. tutor/trainer.
What? Do we want to learn? (e.g. Selenium web driver with Java).
When? Timeline, amount of time available.
Where? Online courses, videos or text based courses.
Why? What's the goal? (e.g. Automated testing using Java/Selenium).
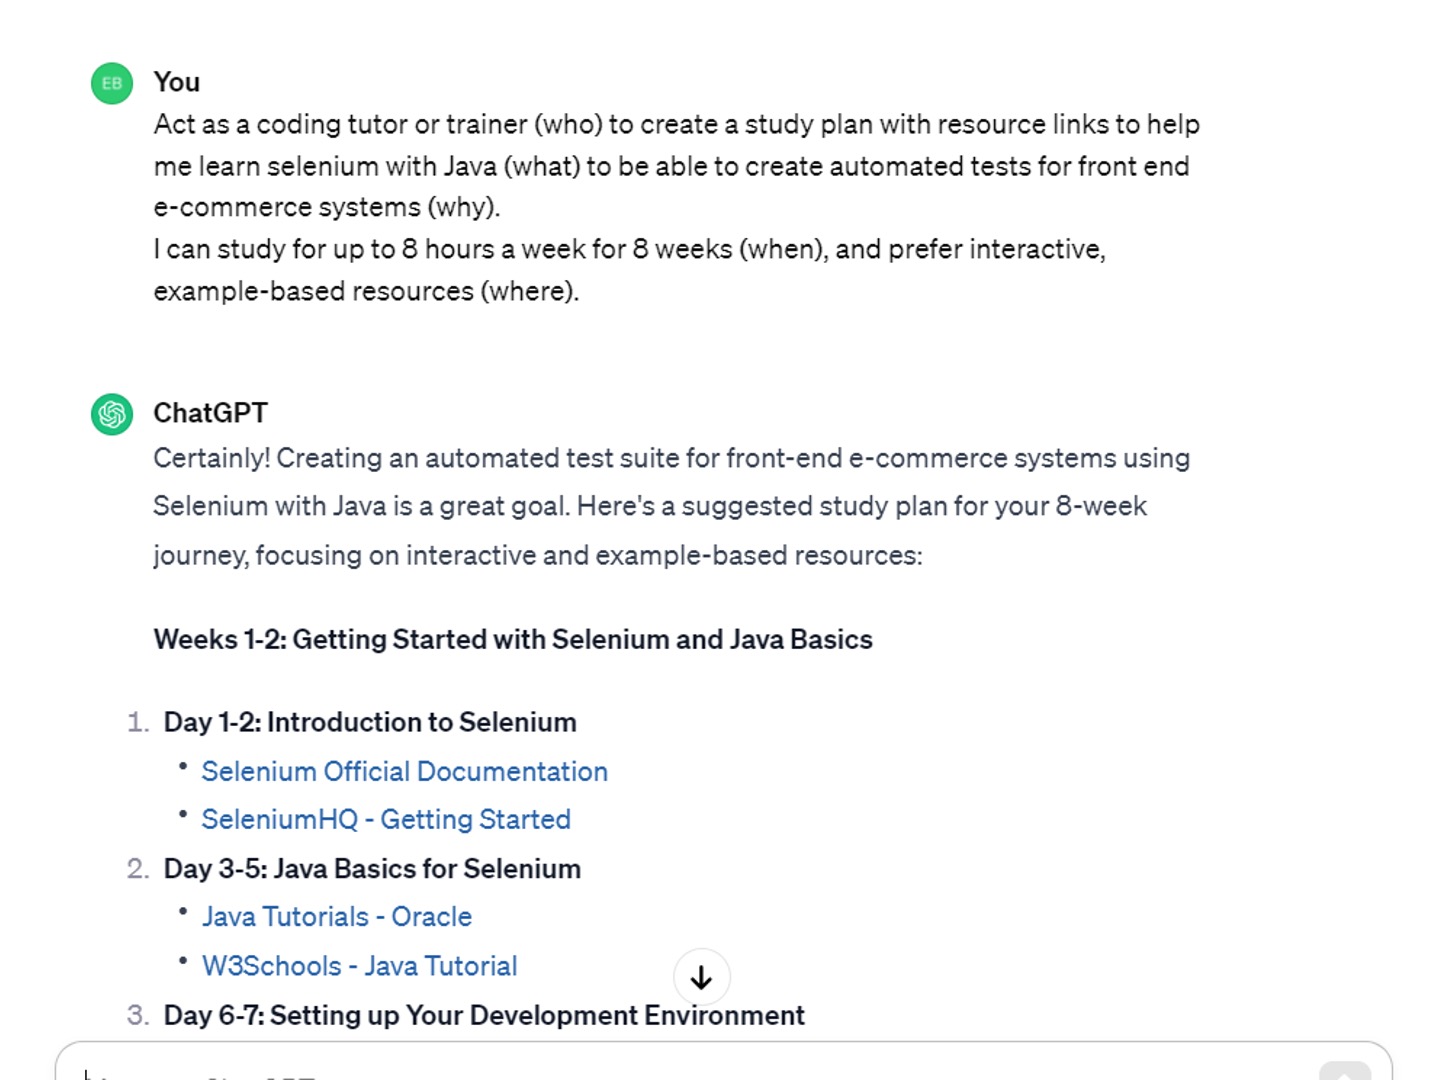
Based on this example, this gives us the following prompt to input into the LLM:
Act as a coding tutor to create a study plan to help me learn Selenium using Java to be able to create automated tests for front end e-commerce systems. I can study for up to 6 hours a week for 8 weeks, and prefer interactive, example based free resources.
Suggest reliable web resources that can be easily found through a web search or by directly visiting the official websites.
The above style of prompt should give a structured plan based on the 5W what, in the timelines defined in the when. I’ve found this approach helpful when learning Cypress for example.
Do we need a framework?
Some of the advantages of using this framework in ChatGPT (or another LLM):
Gives a structured plan, with suggested resources.
It's adaptable- if our focus or timelines change, we can change the study plan.
Keeps it relevant- we can add or remove topics/elements of the plan where necessary (not possible in an ‘off the shelf’ course)
As I’ve started getting to grips with Large Language Models, code tools such as GitHub co-pilot, and seen some of the really interesting talks about AI in the test community I was keen to understand more about the fundamentals behind AI- the AI-900 course was ideal, and I can strongly recommend it.
This has given me a really useful background in the fundamental concepts of AI and how its practically applied- it covers chat bots, prediction models, large language models etc. so certainly covers a wide range of relevant topics. The hands on ‘sand pit’ exercises were really well designed and give a good insight into how regression, machine learning, training data and other fundamental AI concepts work. At the same time, the course is engaging and pretty short, so I’d recommend anyone with an interest in AI to give it a go.
In terms of the course itself and the exam, it has a thorough self learning path which along with the self practice exam is all you really need, but I can also definitely recommend John Savill’s AI-900 - Azure AI Fundamentals Study Guide as a practical summary.
This post will give some practical advice on installing Cypress and Playwright to create and run some simple UI tests, and a brief comparison between the two tools.
Alongside Selenium, Cypress and Playwright are currently amongst the most widely used test automation tools. There is a lot of discussion about the pros and cons of each tool, which is the most suitable for a given project etc. but you may want to try these tools out for yourself, this post will help you to get up and running, and run some basic UI tests.
To evaluate these tools myself, I set up a Git repo to do some basic UI automation, one using Cypress the other Playwright to compare them side by side (I will add Selenium Webdriver soon). If you can set up these tools locally, you will be able to follow and implement the simple test plan outlined below, or alternatively clone the material in the repo itself and run it.
ⓘ For reference, I installed both tools on a Mac, and the system under test/code used was JavaScript. However, the instructions I link to cover Windows/Linux and other code bases.
Test Plan
To compare these test tools, I used the 5W approach in ChatGPT to come up with this outline of a test scope:
Page Loads: Ensure that specified page load correctly.
Navigation: Verify the navigation within the web shop.
Registered User Login: Test the login process for registered users.
Add to Basket and Checkout: Check the functionality of adding items to the basket and completing the checkout process.
The system under test used here (https://www.demoblaze.com) has proven to be well suited for e-commerce UI testing, but you of course may have a preferred alternative (generally we’ll be covering standard e-commerce transactions).
Setting up Cypress and run tests
The documentation on installing Cypress itself is pretty user friendly, so rather than repeat material this section will highlight some of the key areas.
ⓘ If you see a ‘Cypress Configuration Error’ when running ‘npx cypress open’ , ensure you are running cypress from the right folder level, it needs to be in a folder above the cypress.config.js level to avoid any config errors.
Provided the installation has been successful, my preferred approach is to open a command line/terminal in the project folder, and run:
npxcypressopen
This should open up the Cypress Launchpad, and for this post we’ll be concentrating on E2E testing (to cover an e-commerce system).
Once cypress is up and running in the browser, my approach was to follow the Getting Started page to set up the first ‘E2E’ test, and build on that to start covering the project plan:
For UI tests it’s very useful to not have to explicitly use the url of the system under test (e.g. www.demoblaze.com). We can define the baseUrl in the cypress.config.js in project root. Cypress calls this base url when ‘/’ is used in an E2E test, e.g.
cy.visit('/')// uses the baseUrl (i.e. www.demoblaze.com in our example) in the cypress.config to open the url.
Fixtures
A lot of the UI tests in this plan use the same user details info for each test, and rather than repeat those strings in each test, we can define a fixture file to store all our log in data, and reuse it in each test.
Example:
In the fixtures file, the userDetails class contains user log in details:
This class is used in E2E tests, e.g. in E2EloginPurchases test file, we get the fixture file:
..and from that line on we can use the details from the fixture file in the test (i.e. the E2E test class is getting the userDetails.password & userDetails.username are those defined in the fixture file):
In addition to Cypress documentation, this blog proved useful in understand more about Cypress Fixtures:
[https://testersdock.com/cypress-fixtures/](https://testersdock.com/cypress-fixtures]
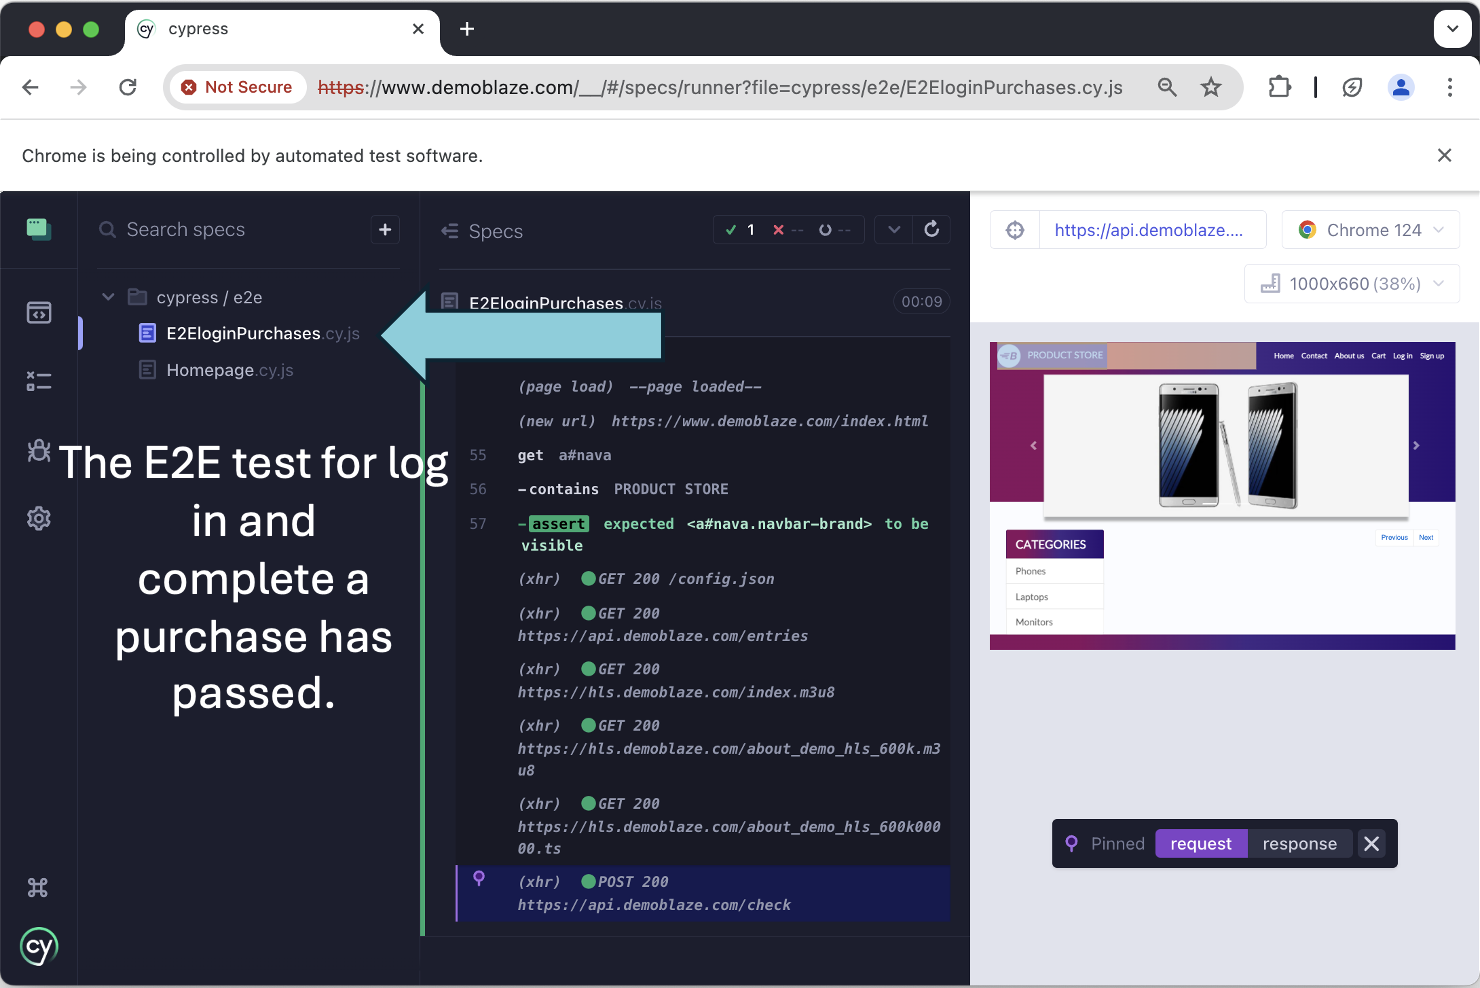
Time Travel
The time travel feature is effectively a record of the changing state of the system under test, which has proven to be invaluable in understanding how the website behaves in response to our test inputs and for debugging.
Lets demonstrate this by looking at an E2E test that uses our baseUrl set in config, and some of our imported fixture data.
Example
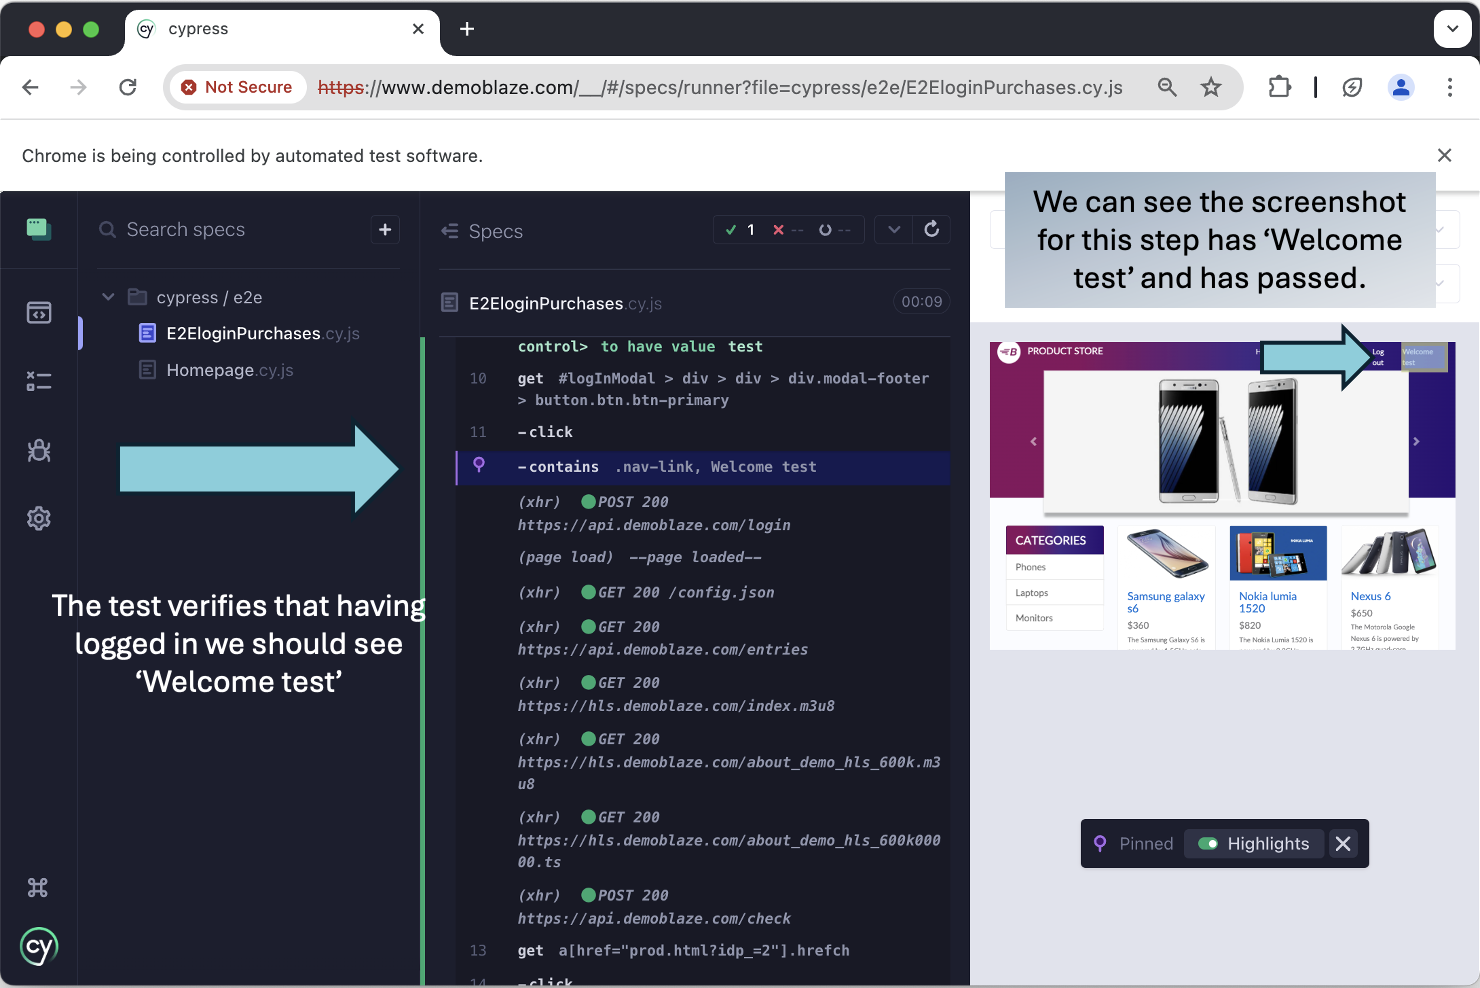
The E2EloginPurchases E2E test verifies the log in process works with a valid username/password, and checks a successful log in message appears on screen.
In the spec window of Cypress browser we can see our test code has used our configured baseURL and knows ‘/’ should be ‘www.demoblaze.com’, and uses the imported config to pass in userName & userPassword.
On the successful run, we can see the test step to verify a message appears on screen ‘Welcome ' ('Welcome test' in this case):
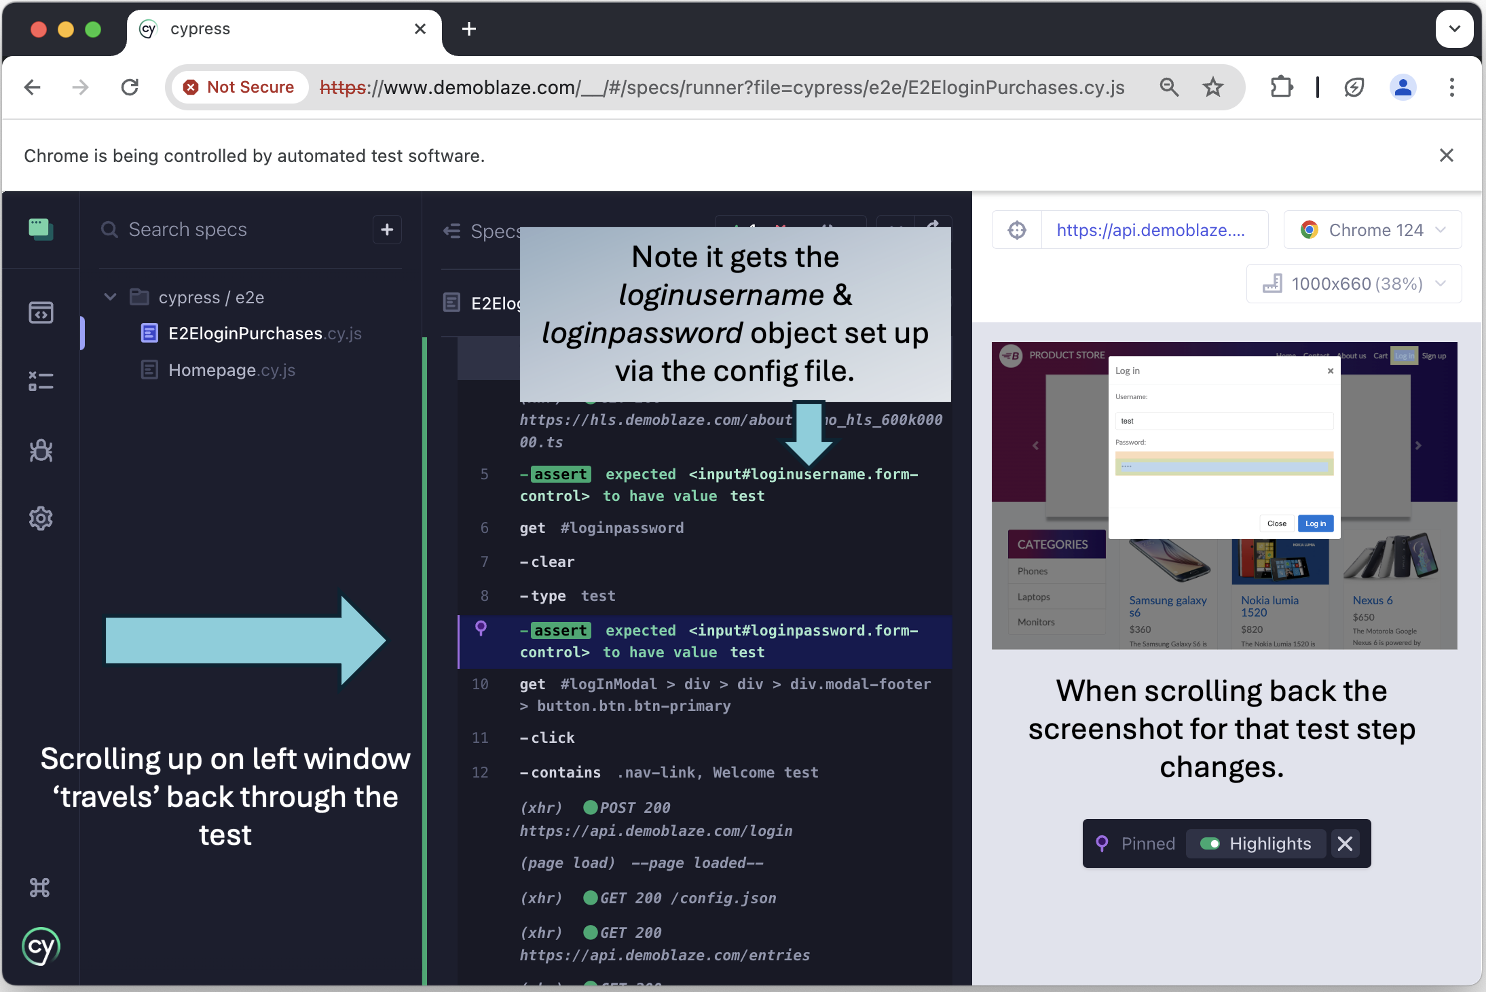
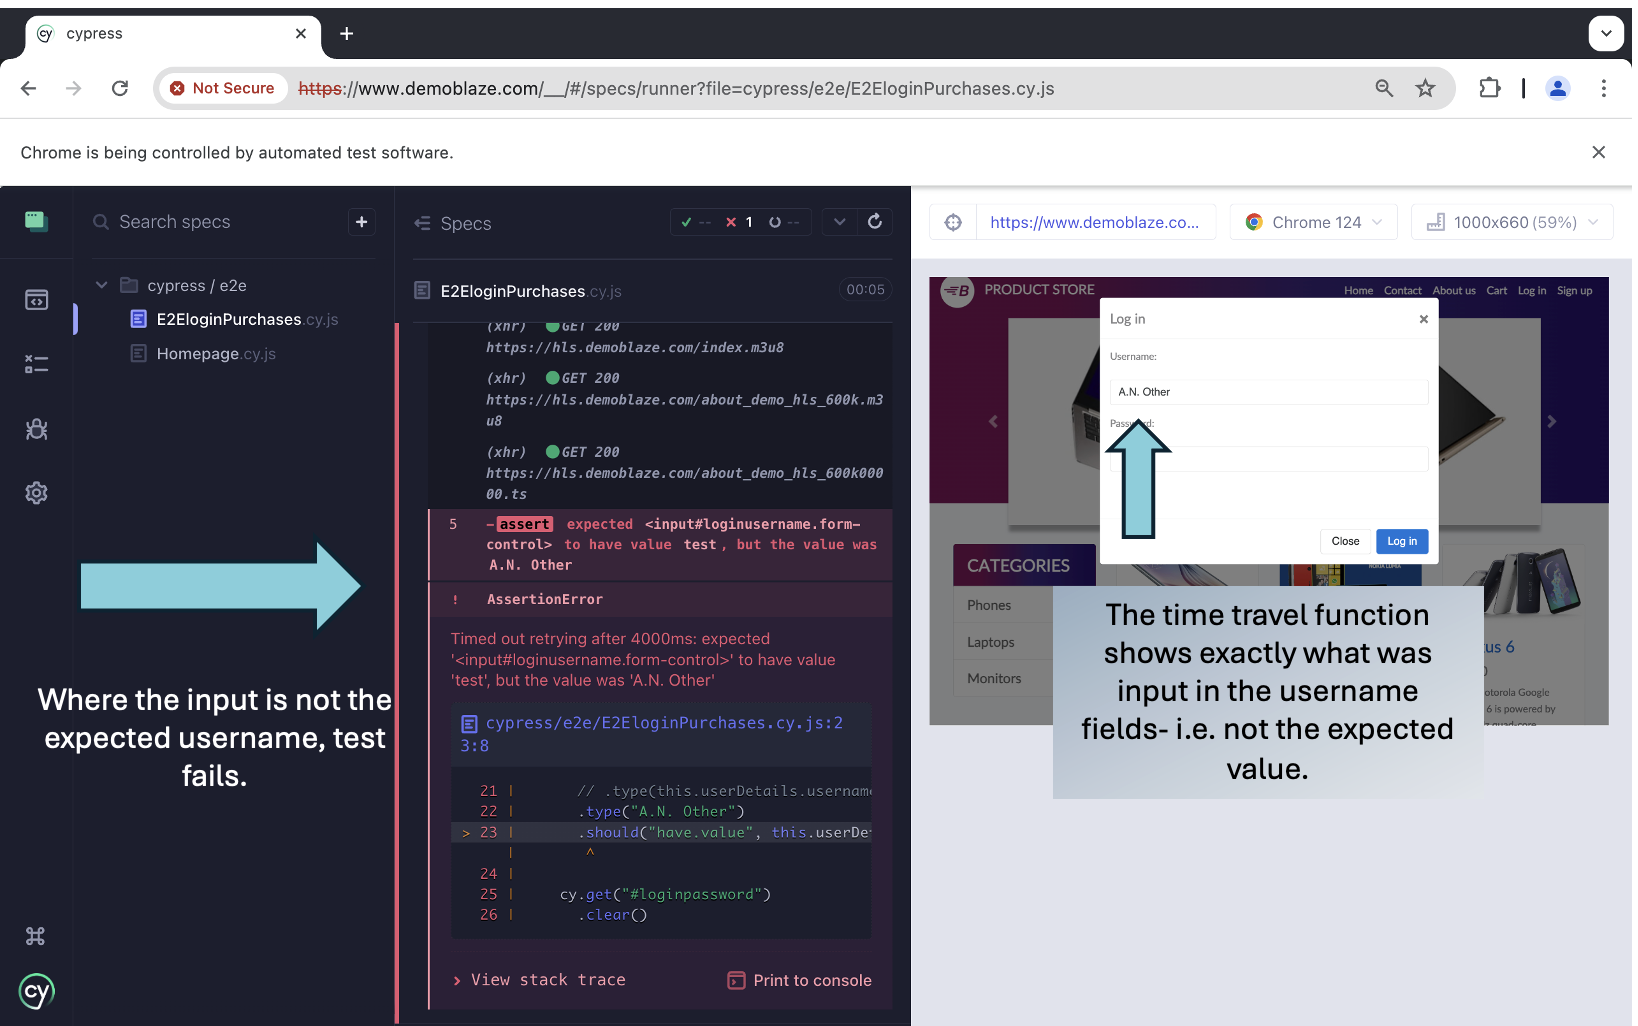
The advantage of time travel is that it makes it really convenient and efficient to check the variables we’re passing in, and how the system behaves. If we have a failing test, we can efficiently debug by ‘travelling’ to the steps in question. In the example below, the test step expects a different user name to what’s being passed on screen.
The failed step is identified and we can have a closer look at exactly what was happening at that point on the system under test.
Cypress - Summary
In summary, the Cypress documentation allows us to get up and running pretty quickly, and the example given of setting up the first test allows us to build up the test plan. In the post we had a quick look at setting a base url and test config, and I personally I was impressed with the [time travel feature]- {#cypress_page_locator}some of the page elements on the system under test were difficult to identify in javascript, the time travel showed the exact stage and screen where the issues were, which was invaluable when it came to debugging.
Set up Playwright and run tests
This is a rough guide to get up and running (follow the links for more detailed instruction) and we’ll use the same test plan as mentioned in Test Plan.
Installation
To install and configure Playwright, I used the following guide which got me up & running:
I recommend setting up the folder structure using Visual Studio Code (see step 2 of the linked guide.) You’ll also need an NPM package installed as mentioned in the guide, this should be installed in step 6 by running:
npminitplaywright@latest
ⓘ during installation step 6 ‘Execute Playwright Test Script’ would not work for me, my solution was to change directory (in command line/terminal) to my playwright project folder, then run: npm init playwright@latest
Once installed you should see a green run icon in the test spec window:
Create tests
The initial set up of Playwright helpfully includes a file called tests/example.spec.ts, this gives us a solid example to explain how the tool works, and I used this to build up the test scope.
import{test,expect}from'@playwright/test';test('has title',async({page})=>{awaitpage.goto('https://playwright.dev/');// Expect a title "to contain" a substring.awaitexpect(page).toHaveTitle(/Playwright/);});test('get started link',async({page})=>{awaitpage.goto('https://playwright.dev/');// Click the get started link.awaitpage.getByRole('link',{name:'Get started'}).click();// Expects page to have a heading with the name of Installation.awaitexpect(page.getByRole('heading',{name:'Installation'})).toBeVisible();});
To run tests, use the following command in either VSC or the command line/terminal.
npxplaywrighttest--
Playwright codegen
Playwright has an impressive feature to record script automatically called Codegen. In theory it can record the whole log in, add item to basket etc. steps for us, but I found it more useful to find those page elements which were awkward to find and use in Cypress.
For example, if we run the following command, the specified website and Playwright inspector will load up.
npxplaywrightcodegenbrowserstack.com
We can undertake our actions on the website, e.g. lets click log in, and input a user name and password. As you can see in the clip below, the user actions in the browser is tracked in the Playwright Inspector, so we can see the locators, tags and roles etc.
In my experience, it didn’t quite capture the whole test code I needed, but it definitely saved time in getting the right elements.
Rather than have to repeat the log in steps explicitly for each test that requires a logged in user (e.g. adding items to cart and checking out), its possible to save the ‘logged in state’ to a setting in the .config.ts file:
storageState:"playwright/.auth/user.json"
This object points at auth.setup (which is in the testDir location specified in the config). This file is effectively the successful log in test, and writes its logged in state back to the user.json file configured in playwright.config:
Traceviewer allows us to review a record of completed tests, similar in a way to Cypress Time travel (which we looked at previously), it reports the test result and allows us to check the outcome of each test step. The benefits here are for reporting itself, and when necessary for debugging, we can review a failed test and see exactly where/why it failed the given test step.
To enable traceviewer, we need the following value in the config file.
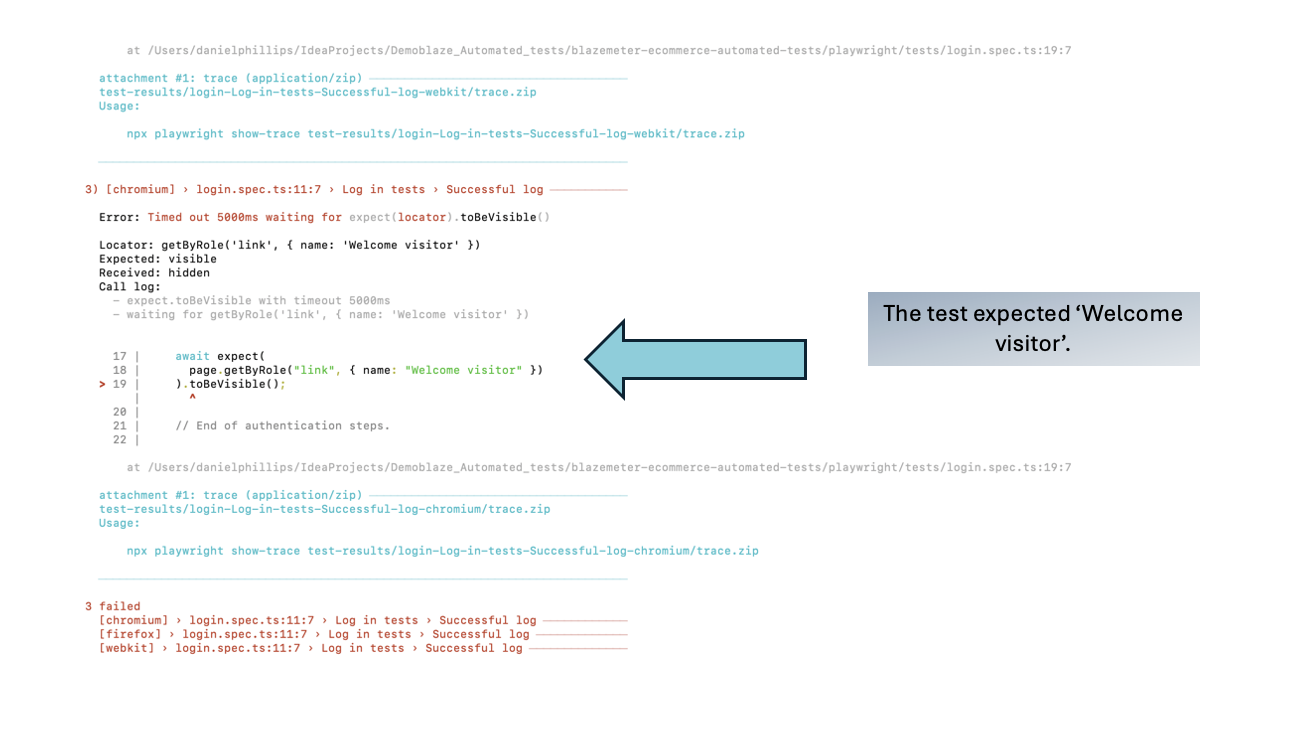
Lets demonstrate how to use traceviewer by change one of our passing tests so it fails. In login.steps , the log in message when logging in is ‘Welcome test’ (test being the username), so lets change the expected value in the test to ‘Welcome visitor’:
test.describe("Log in tests",()=>{test("Successful log",async({page})=>{constloginPage=newlogin(page);awaitloginPage.initializeLocators();awaitloginPage.loginFunction("test","test");awaitexpect(page.getByRole("link",{name:"Welcome visitor"})).toBeVisible();
To run traceviewer, go to the command line/terminal and input:
npxplaywrighttestlogin.spec.ts:10--traceon
This runs traceviewer for the specified test.
Traceviewer saves the test run in a zip file, you can also view it in the browser, for example:
ServingHTMLreportathttp://localhost:57023. Press Ctrl+C to quit.
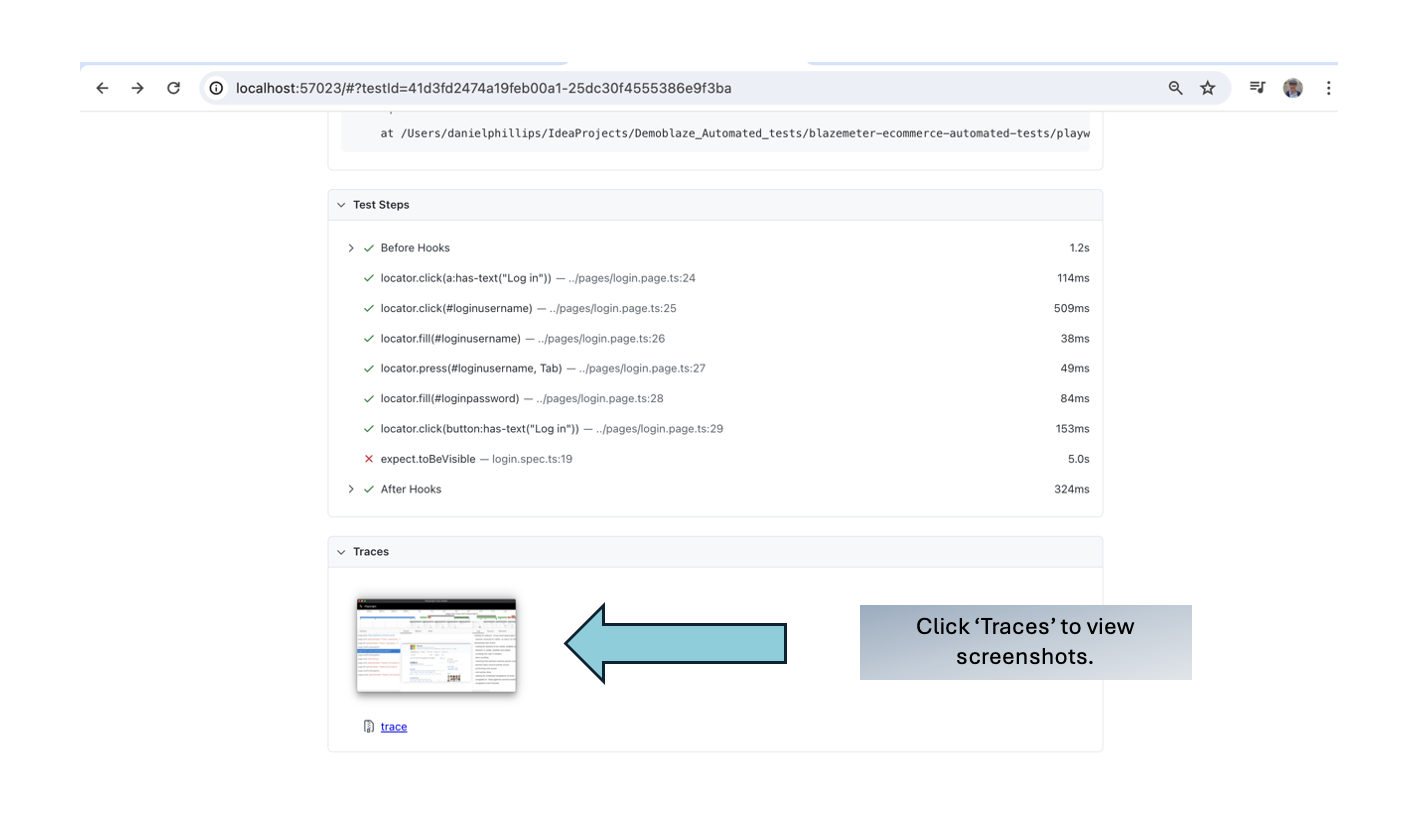
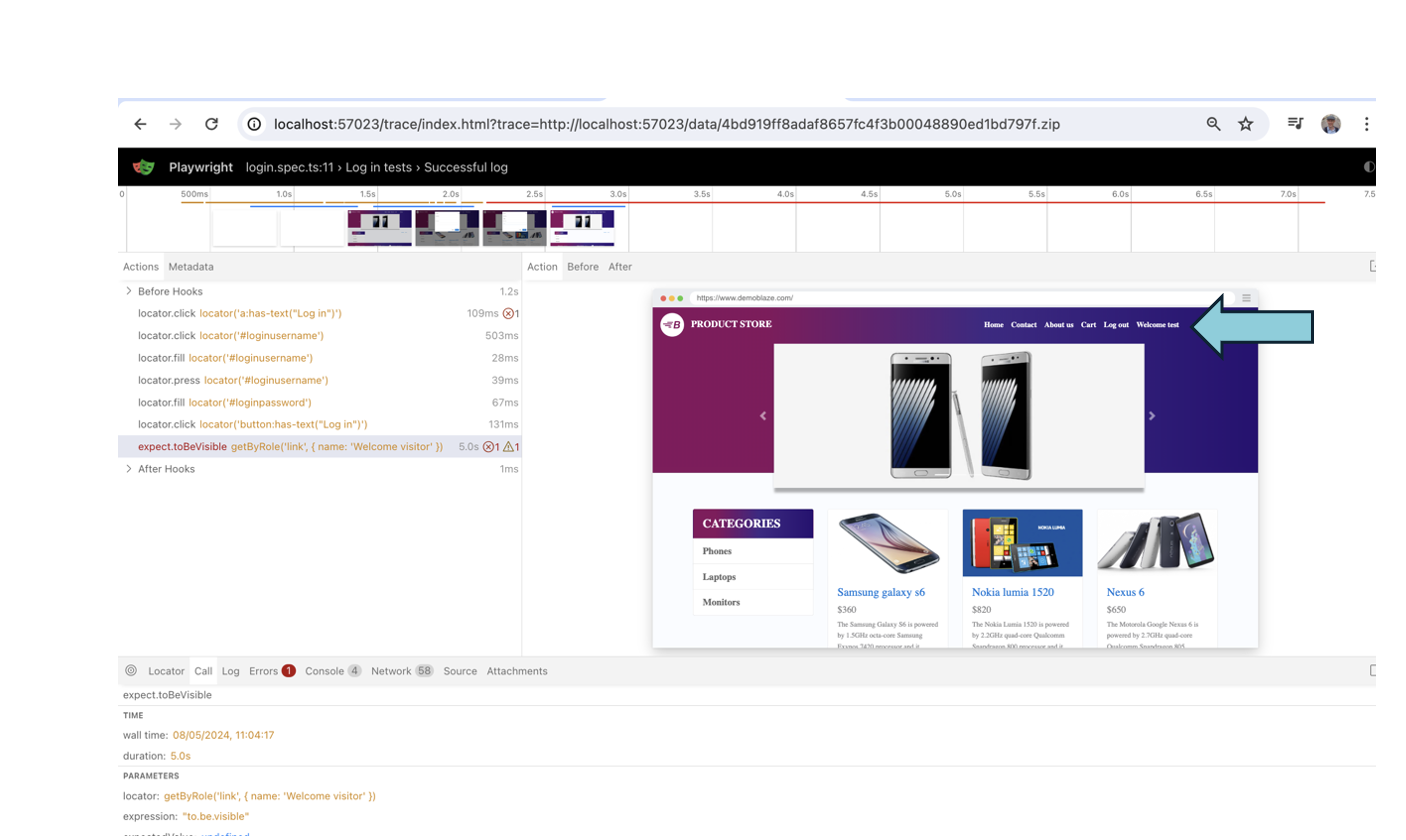
The test report shows us the failing test, and clicking trace allows us to see screenshots of each test step. We can see that the message on screen is ‘Welcome test’ not ‘Welcome visitor’.
This is a really good explanation and summary of Traceviewer, from the official Playwright channel:
Summary - Playwright
I found Playwright relatively straightforward to get up and running quickly, and am impressed by the utility and intuitiveness of codegen and traceviewer. We used a simple example above for traceviewer but it definitely enables quick and effective reporting and debugging, and the codegen tool did help in finding the more awkward page elements which took more time in Cypress.
Cypress versus Playwright (and Selenium)
This is a summary of what we’ve seen in this exercise, and compares to a tool I am more familiar with, Selenium.
Both Cypress and Playwright are marketed as more ‘modern’ to use than the older Selenium, and this exercise has demonstrated to me that both Cypress & Playwright are more ‘lightweight’ to install, intuitive to use and quicker to get up and running and getting good UI test coverage efficiently. Cypress documentation states it should ideally be used when building a web application, and I can see how its user friendliness would enable devs/testers to efficiently undertake good test driven design.
The debugging and selection tools mentioned in this exercise were a big help, and well designed in my opinion. The impressive built in reporting tool (Traceviewer) in Playwright is something Selenium lacks (at least without a plug in).
However, there are some points to consider when we compare to what is still the mostly widely used alternative, Selenium. Both Cypress and Playwright can be described as ‘opinionated’ i.e. they are designed in a specific way to work efficiently but therefore have constraints on how they are used. For example, both tools have implicit waits (i.e. a test step waits for an element to load). This is at first a glance an advantage, it allows the page to load and the test to proceed. However, it may mask a performance issue, perhaps the delay in loading is not acceptable for the users. Selenium does not have this implicit wait, you can add one to a test but its not the default.
While the ease of use can appear to be an advantage, perhaps Selenium’s flexibility in being able to integrate other third party tools and plug ins means it remains more adaptable, and can be used in a broader range of projects.
Given the age of Selenium, which has been around substantially longer than the other tools, it has a wealth of support and knowledge available online, the others are building that legacy too but you will generally find someone has had the same issue you have in Selenium!
To wrap up, I would recommend anyone weighing up the pros and cons of Cypress versus Playwright (and of course Selenium) to try out the tools as demonstrated in this blog. I found it invaluable to see for myself how Cypress and Playwright really do offer something different, and perhaps more ‘modern’, but its interesting to note I use Selenium on my day to day work.
ⓘIn future I will add a 3rd project to my github repo to cover off the test plan for Selenium webdriver.
 Now when visual comparison example test runs, it goes to the landing (index) page, and verifies the screen is exactly as per visual-comparison image in the
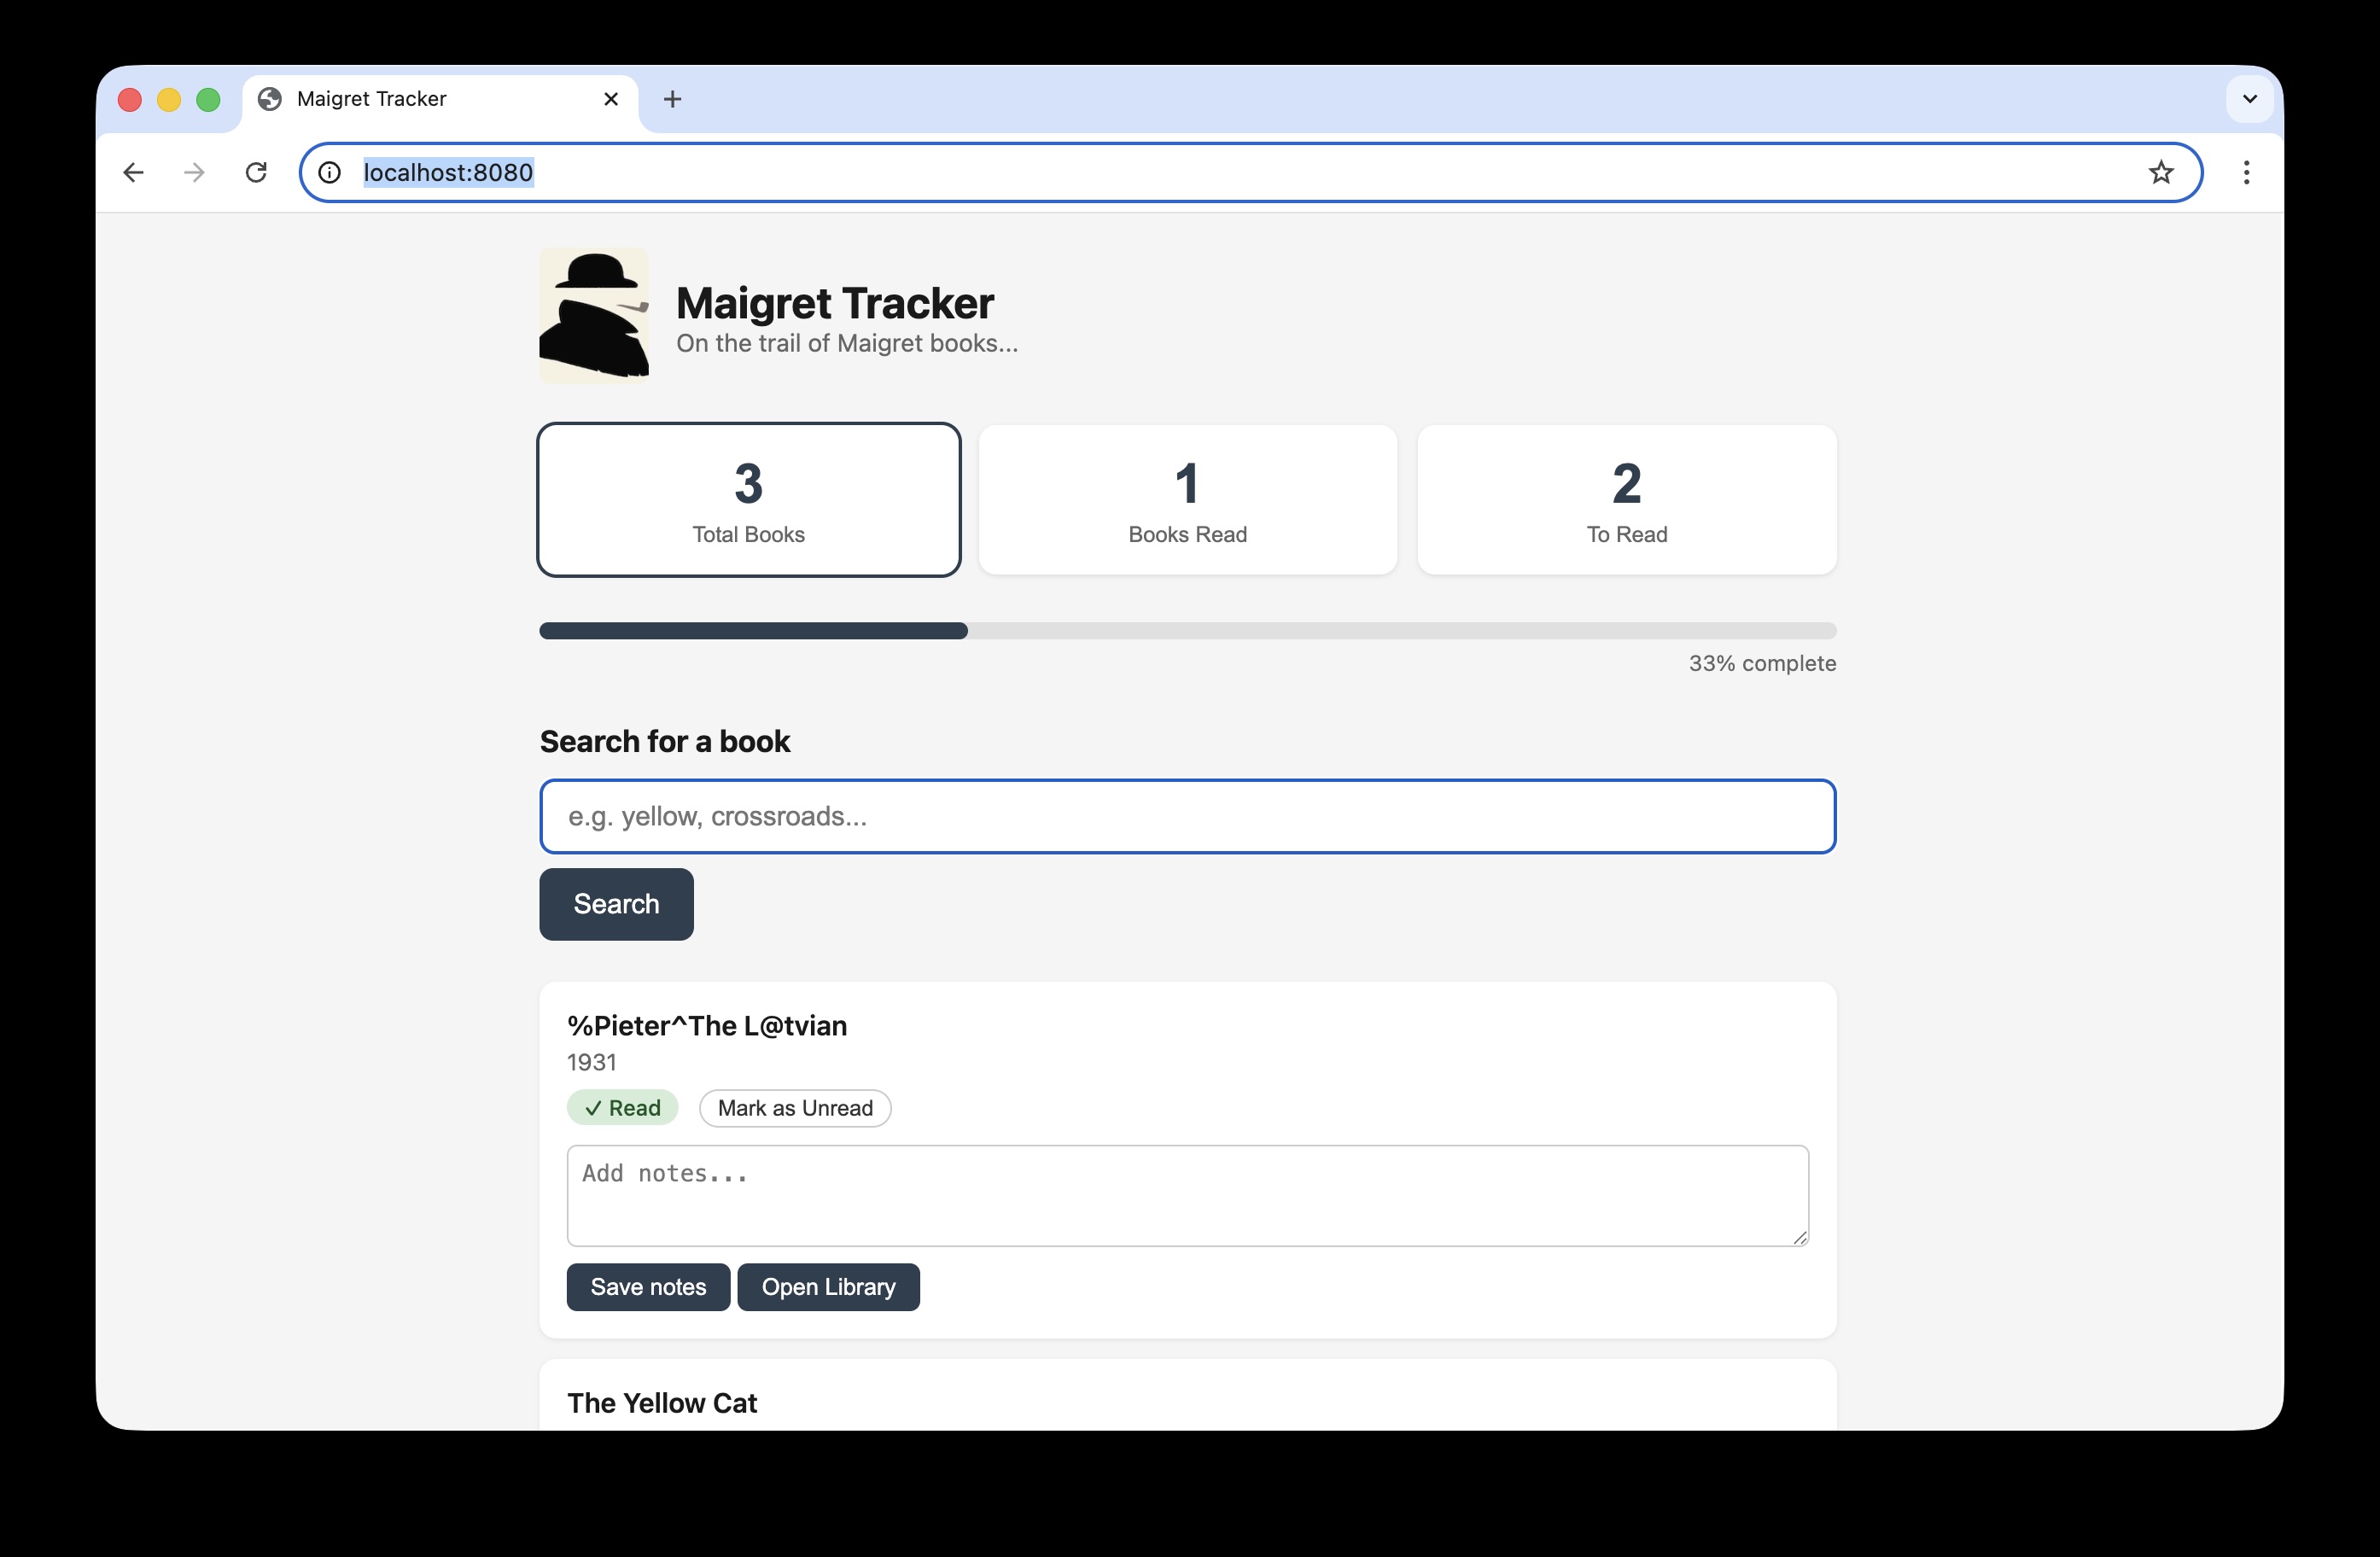
 –>
–>